





You asked three firms for proposals last quarter. One came back at forty pages, one at six, and the third was a slide deck with a price on the final page. No two used the same structure, the same assumptions, or even the same definition of “finished.” One quoted a number roughly four times another. Now you have to choose, and justify the choice to someone who will ask why.
That mess is not your fault, and the price gap is usually not what it looks like. The useful question is narrower than “who is best?” It is this: after the invoices stop, who owns the thing that was built?
In short: judge a BI consulting firm by how ownership transfers to your team when the engagement ends, not by brand tier or day rate. Ask for the documentation, access and contract terms that let you run what was built without the firm, and treat a price gap as secondary until those are settled.
This guide covers what these engagements contain, what they cost across different markets, why the market-size figures you will be quoted contradict each other, and the contract terms that decide whether you finish with a capability or a dependency. For the scoring mechanics (how to weight criteria and rank a shortlist), see the companion piece on choosing BI consultants.
On this page
- What do business intelligence consulting services actually include?
- What does BI consulting actually cost?
- Why do BI market size estimates disagree?
- Should you build in-house or hire a BI consultant?
- Seven trust signals that separate credible firms from the rest
- Nine contract clauses that limit vendor lock-in
- Your first 30 days: from longlist to signed statement of work
- Frequently asked questions
Key Takeaways
- Judge a BI consulting firm by how ownership transfers to your team at the end, not by brand tier or day rate.
- Clutch’s average hourly bands for BI firms differ by more than four times between the cheapest and dearest countries it lists; location is one of several factors it names.
- Gartner forecasts worldwide software spending to grow nearly three times as fast as IT services spending in 2026 (15.5% against 5.3%). Our reading, which the figures suggest but do not measure: capability is being bought faster than it is being absorbed.
- Gartner reports that organizations with successful AI initiatives invest up to four times more, as a share of revenue, in foundations such as data quality, governance, people and change management.
- Published BI market-size figures for 2025 range from $23.5 billion to $43.48 billion, and the scopes the publishers disclose do not explain the gap.
- Nine contract clauses covering IP, data portability, documentation and exit terms do much to decide whether you keep control after go-live; your platform and license choices matter too.
- Build-versus-buy is not a permanent choice; moving in-house later is realistic only if the first engagement is designed for it.
What do business intelligence consulting services actually include?
It helps to read an engagement as three phases; the difference between a firm that leaves you stronger and one that leaves you dependent usually shows up in the third.
Strategy comes first: establishing which decisions the business needs to make faster, which source systems hold the relevant data, and which platform fits the situation you are actually in rather than the one a vendor would prefer you were in.
Implementation is usually where most of the budget goes. Someone has to connect the ERP, the CRM, the warehouse system and whatever else accumulated over the years into one coherent data foundation, then build the reporting on top. For a manufacturing business that often means pulling production and machine data into a live operational view. For a logistics operator, a control-tower picture of fleet and delivery performance. For professional services firms, it is usually utilization and project margin across fragmented time and billing systems.
Enablement is the phase that gets cut when timelines slip. It means your people can maintain, extend and trust the result once the consultants have gone. A dashboard nobody opens is expensive decoration. A dashboard nobody can change is worse: it is a dependency with a monthly invoice attached.
Some firms stop after strategy and hand you a slide deck. Others build well but keep the keys, structuring the relationship so that every future change routes back through them. For an end-to-end engagement, shortlist firms that cover all three phases, or show how a partner or your own team fills the gap, and that can point to clients now running the result without them.
There is a reason to weight that third phase heavily, and it shows up in where the world’s money is going. Gartner’s July 2026 forecast puts worldwide IT spending at $6.37 trillion in 2026, up 14.2%. The growth is very uneven:
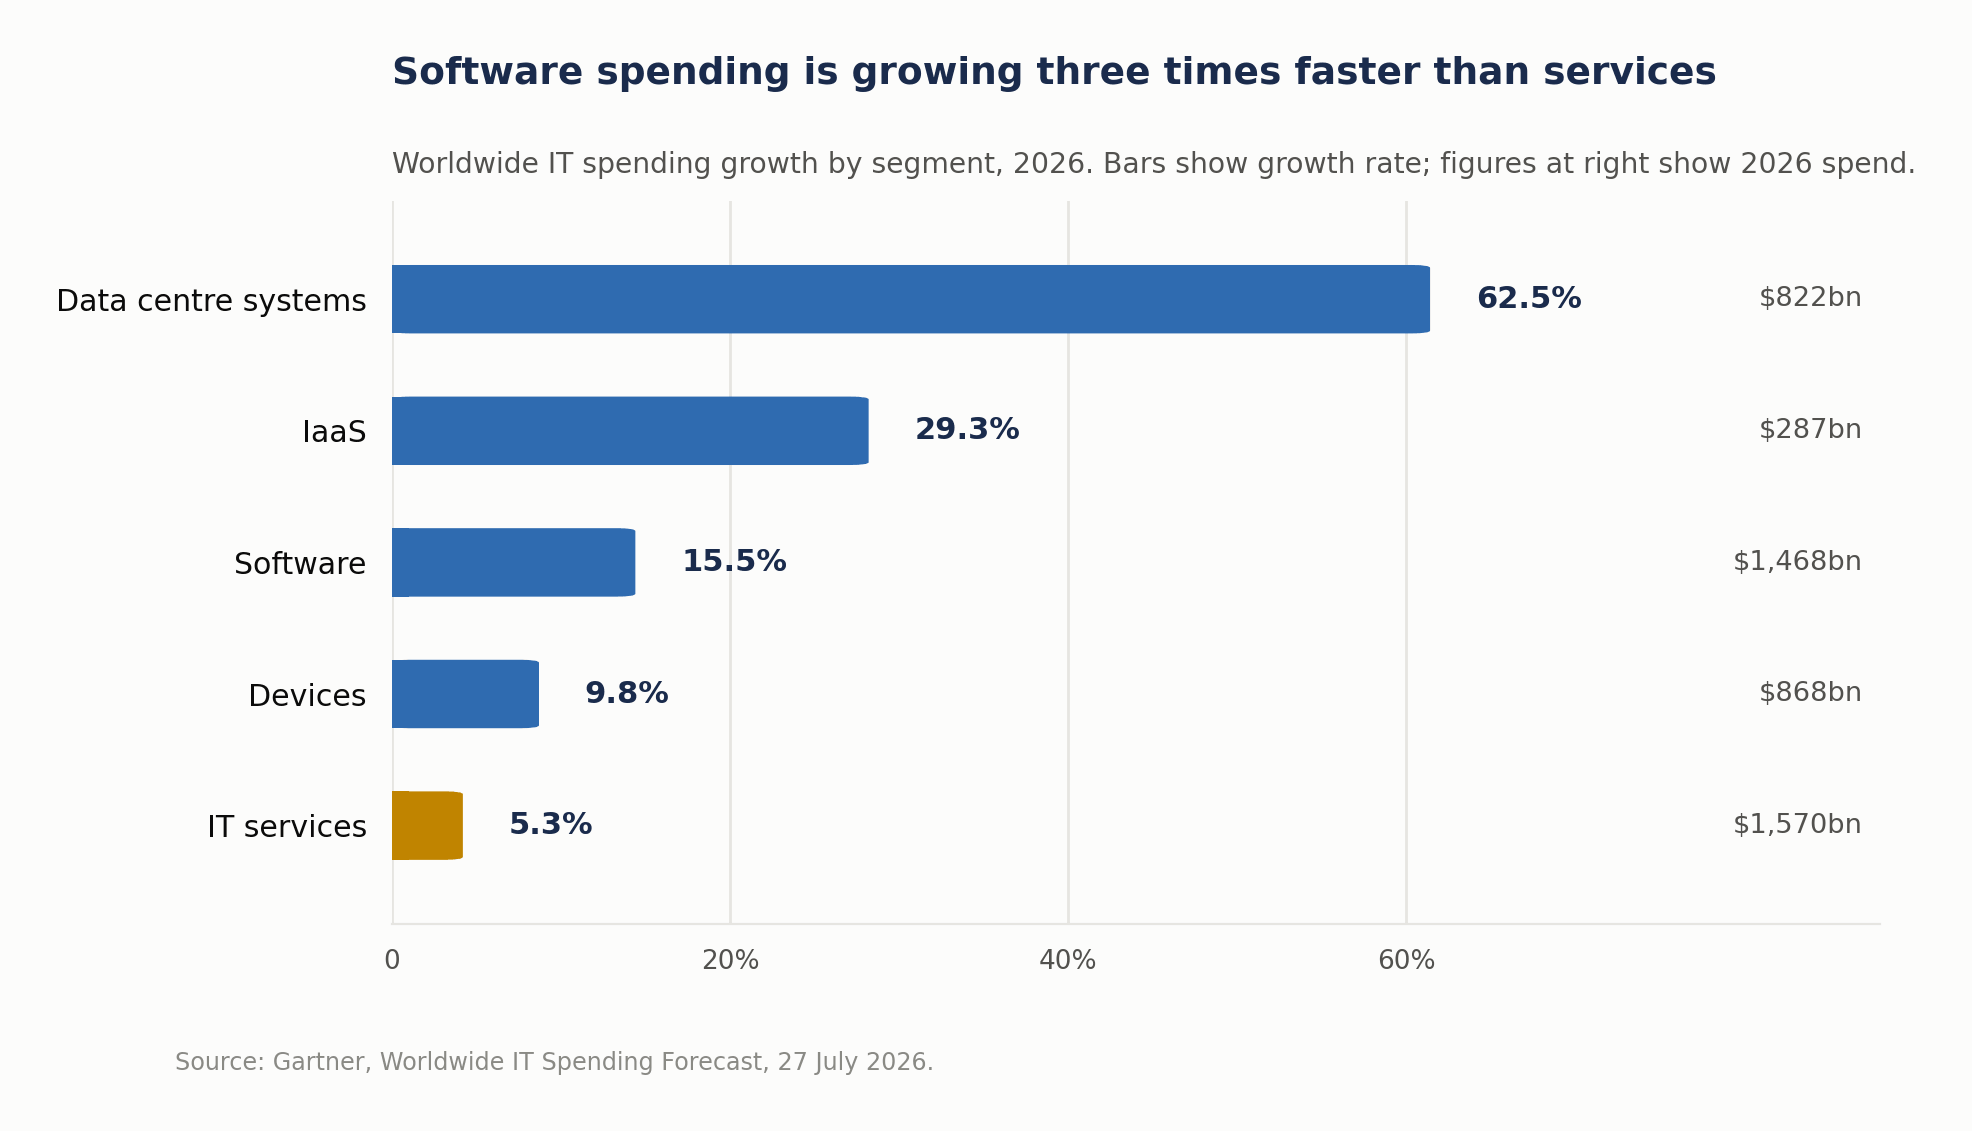
Source: Gartner, 27 July 2026. Communications services ($1,354bn, +4.4%), the remaining segment in Gartner’s table, is left out here; the $6.37 trillion total includes it.
Read the last row against the first three. Spending on infrastructure and software is accelerating hard, while IT services (the category that includes consulting and implementation work) grows at about a third of the software rate. Gartner does not draw a conclusion from that. Ours, a reading rather than a measurement, is that capability is being bought faster than organizations are building the capacity to absorb it.
If that reading is right, the gap is what your engagement either closes or widens. Gartner’s April 2026 release points the same way from another angle: organizations reporting successful AI initiatives invest up to four times more, as a percentage of revenue, in foundational areas such as data quality, governance, AI-ready people and change management than those reporting poor outcomes. That is an association, not proof of cause, but two of those areas are what the enablement phase is for, which is why it deserves more scrutiny than the demo.
What does BI consulting actually cost?
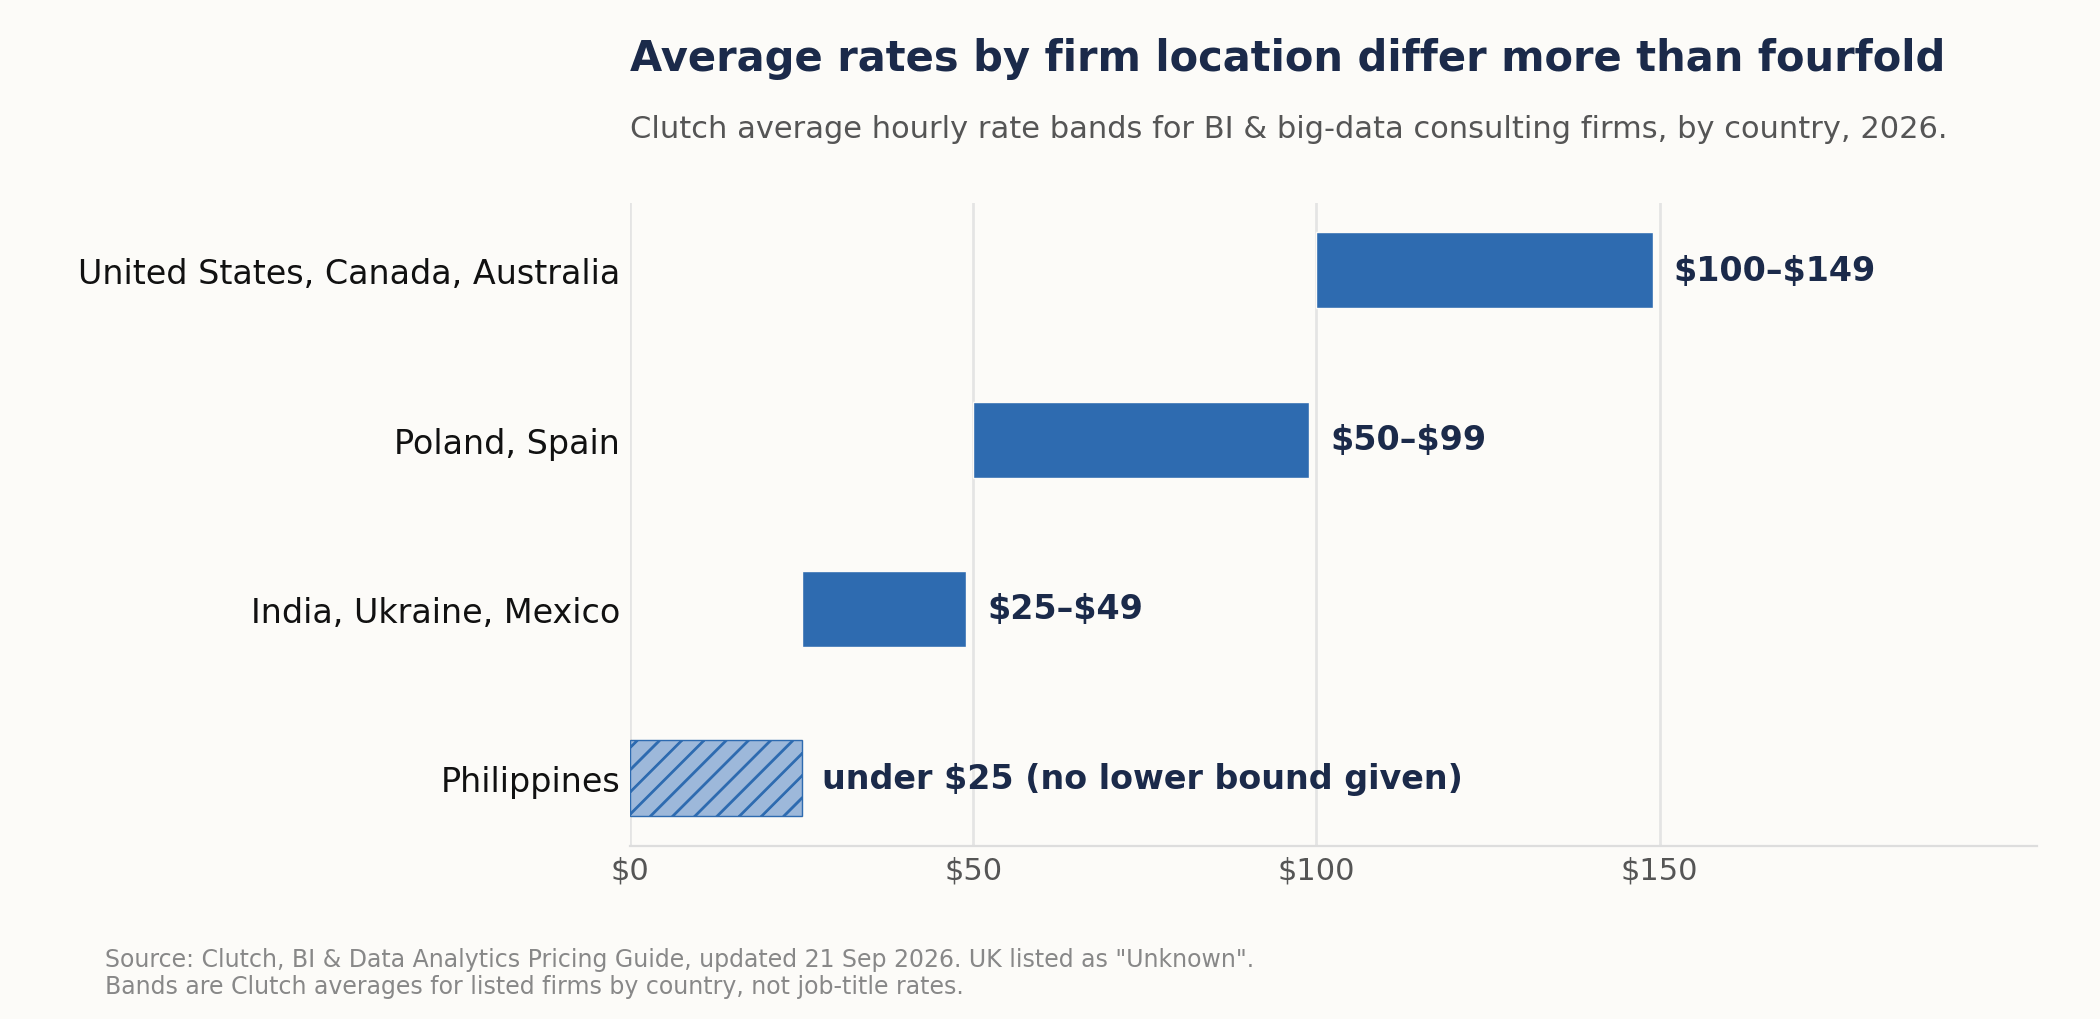
Published average rates for BI firms differ by more than four times depending on where the firm sits, so knowing what drives that variance is more useful than any single number.
Clutch’s 2026 pricing guide gives average hourly bands for BI and big-data consulting firms on its platform, by the country where the firm is based:
For project size, Clutch reports that BI and big-data consulting and systems-integration projects reviewed on its platform typically cost $10,000 to $49,999. That is the typical band on a four-step scale running from under $10,000 to over $200,000; the spread behind it is not published, so treat it as orientation rather than a market norm. For individual contractors rather than firms, the freelancer management platform YunoJuno reports an average of $85 an hour and £517 a day for BI consultants, based on bookings through its own network.
One detail is worth pausing on. Clutch’s headline average of $25–$49 an hour for BI and analytics consultants on the platform sits below the bands for the United States, Canada, Australia, Poland and Spain in its own table. The page does not show how that average is weighted; many listings in lower-rate markets would be one explanation, but the page does not let you confirm it. The figure can be correct and still tell you little about your shortlist.
Three things follow for you as a buyer:
A cheaper proposal may reflect a different geography rather than a different value. A firm quoting at a third of another’s rate may be delivering from a market where that rate is standard, or it may have scoped less, staffed more junior or left more of the risk with you; check which before counting the saving. Lower-rate delivery can work well, but limited time-zone overlap in a phase that needs daily contact can make discovery take twice as long and wipe out the saving.
Compare total cost of a defined outcome, not rates. A $60 hourly rate over 400 hours ($24,000) costs more than a $120 rate over 150 hours ($18,000). As an illustration only: the 300 hours are our assumption for a contained first build, not a Clutch figure. Clutch’s bands put that work at $30,000–$44,700 from a US, Canadian or Australian firm, $15,000–$29,700 from Poland or Spain, and $7,500–$14,700 from India, Ukraine or Mexico. Those are fees only; licenses, cloud consumption, your own staff’s time and support after go-live come on top.
Within one market, look first at seniority and accountability. Ask who is doing the work and who carries the risk if estimates slip. Those answers explain much of the legitimate difference between firms in the same market; scope, platform costs and contract terms explain more. To see all of it, ask every firm to fill in the same rows, and add your own estimate where they cannot:
| Row | What to ask for |
|---|---|
| Team and hours | Named people, their seniority, hours per phase |
| Assumptions | What the price assumes about your data and access; who fixes source-data problems |
| Platform and cloud | Licenses and consumption, during the build and after it |
| Your own time | Staff hours for discovery, testing and training |
| Enablement | Training hours, and the date your team runs the system alone |
| After go-live | Support terms and the rate for changes |
| Exit | Transition help at agreed rates |
Total the rows over three years, not to go-live. That is your own arithmetic rather than a market benchmark, and it is the figure worth comparing.
Duration is the other half of the number, and it is harder to hide than a rate. Our own engagement packages are published with stated durations: a 2–4 week Discovery, a 2–6 month Transform and a 6–18 month Enterprise engagement. Whoever you are evaluating, ask for the shape and the duration first; a firm that cannot say whether it is proposing four weeks or four months has not scoped the work yet. For a worked example from a different kind of project (custom AI rather than BI), our breakdown of what mid-market companies actually pay sets out the cost drivers over three years.
Why do BI market size estimates disagree?
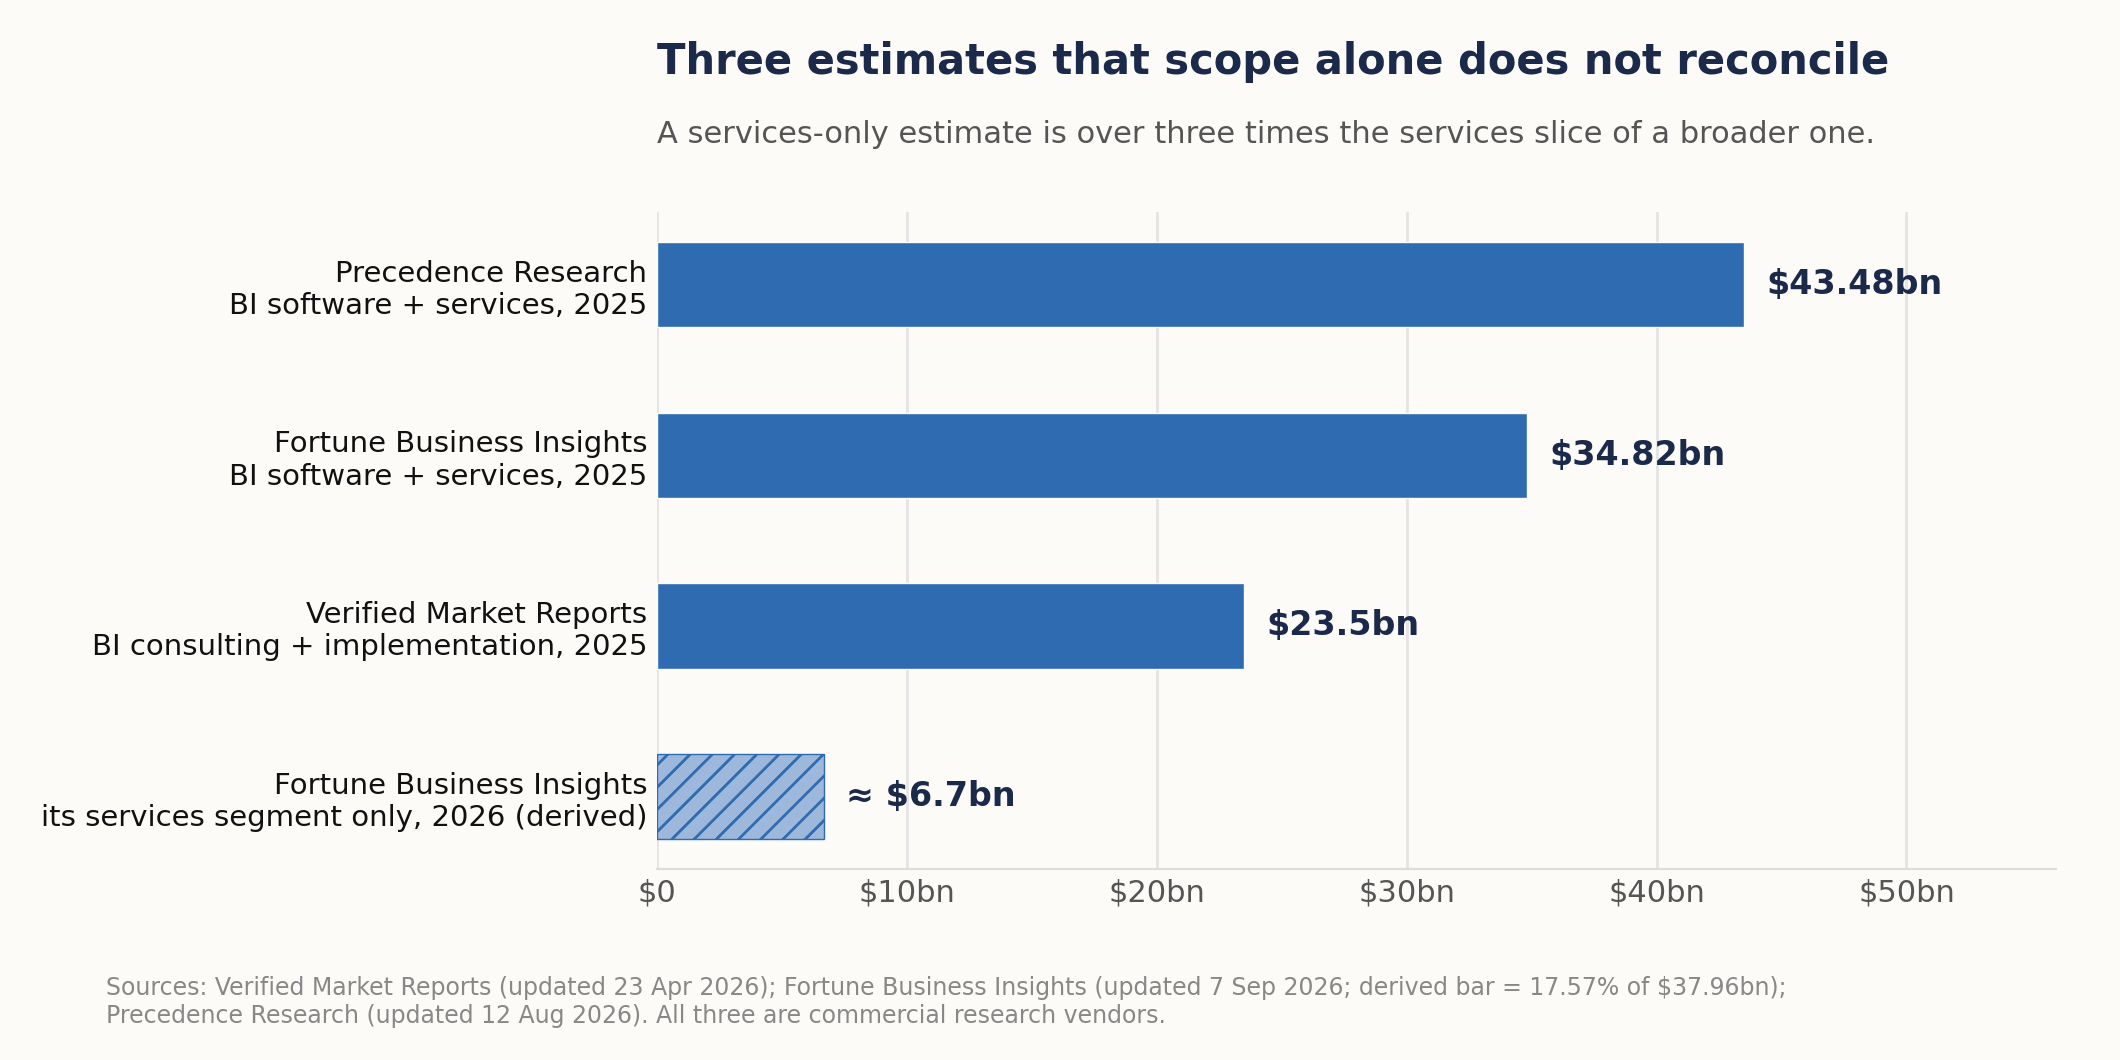
You will be shown a market-size figure at some point, usually to establish that the firm operates in a serious, growing category. Each figure below is what its publisher states. Together they disagree by close to a factor of two, and not in a way their stated scopes explain.
| Research firm | What the figure covers | 2025 | 2026 | Forecast | CAGR | Source tier |
|---|---|---|---|---|---|---|
| Verified Market Reports | BI consulting and implementation services only | $23.5bn | n/a | $45.2bn by 2034 | 8.1% | Commercial research vendor; dates and CAGR inconsistent on its page |
| Fortune Business Insights | BI market, software and related services | $34.82bn | $37.96bn | $72.21bn by 2034 | 8.40% | Commercial research vendor |
| Precedence Research | BI market, software and services | $43.48bn | $49.03bn | $134.94bn by 2035 | 11.99% | Commercial research vendor; states two different CAGRs |
Figures as published by each firm; pages last updated 23 April 2026 (Verified Market Reports), 7 September 2026 (Fortune Business Insights) and 12 August 2026 (Precedence Research).
The tier column is deliberate. All three sell the full report; the free pages show headline figures, not the working behind them. That does not make them wrong, but it puts them in a different evidence category from official statistics: treat the table as a range, not a measurement.
The obvious explanation is scope, and on the scopes the publishers disclose, it does not hold up. Fortune Business Insights splits its own figure into two components: solutions are projected at 82.43% of the 2026 market, which leaves services (consulting, deployment and integration, support and maintenance), at roughly $6.7 billion. Verified Market Reports puts consulting and implementation services alone at $23.5 billion a year earlier, more than three times as much. And Precedence Research and Fortune Business Insights both count software and services, yet sit $8.7 billion apart for 2025.
The pages also disagree with themselves. Verified Market Reports gives $23.5 billion as a 2025 figure in its snapshot and as a 2024 figure in its overview text, and its stated 8.1% growth rate for 2026–2034 is hard to square with its own endpoints, which imply about 7.5% a year from 2025. Precedence Research states a CAGR of 11.99% in most places and 7.26% in its key takeaways; 11.99% is the rate that matches its own start and end figures.
The practical consequence is simple. When a firm quotes a large market number as a credibility signal, ask which report and what it includes: the answer tells you whether they read it or lifted it. All three publishers forecast growth, but a growth forecast says nothing about how many firms will compete for your work, and nothing about whether the one in front of you is any good.
Should you build in-house or hire a BI consultant?
Treat this as two questions rather than one: how mature is your current analytics capability, and how quickly do you need a result?
Two questions, not one: how mature is your analytics capability, and how soon do you need a result?
The outcome is not permanent. A company can move in-house later, but only when the first engagement was structured to make that transition possible.
Conceptual framework, not a data chart.
| Low analytics maturity | High analytics maturity | |
|---|---|---|
| High urgency | Hire, with enablement written in. You lack the skills and the runway to develop them. Choose a firm whose engagement trains your team during the build, not after it. | Hybrid. Your team knows the domain and the data but needs extra hands or specific platform depth. Bring in help with your people embedded in every sprint. |
| Low urgency | Invest before you need it. Start with training and a contained pilot. A short advisory engagement can set direction; a full implementation now would be premature. | Build in-house. You have the skills and the time. External help is still worth buying for architecture review or one specific technical gap. |
The trap is treating the outcome as permanent. It is not. A company can start in the “hire” quadrant and move in-house later, but only when the first engagement was structured for it, with target roles, handover milestones and their dates written into the statement of work. A firm whose commercial model depends on your continued dependency will not design that transition for you, however warmly they describe the partnership.
Urgency is also where honesty matters most. A board mandate or a genuine competitive threat is a real deadline. A vague sense that the company should be more data-driven is not, and buying against a fake deadline is one way organizations end up with dashboards nobody asked for.
Sector shapes the urgency axis more than the maturity one. In retail and e-commerce, the window is seasonal: miss the run-up to peak trading and you wait a year. In financial services and healthcare and life sciences, access control, audit trails and data handling need designing in from the start, which argues for a better-governed build over a rushed one. If part of the question is AI rather than reporting, there are five signs that off-the-shelf AI tools have been outgrown.
Seven trust signals that separate credible firms from the rest
Marketing claims are cheap. These seven signals are observable, which makes them useful for cutting a longlist before you invest time in detailed evaluation.
Observable, which makes them useful for cutting a longlist before detailed evaluation.
Signals six and seven carry most of the weight at mid-market scale, because the system lands with someone who already has a full workload.
Conceptual framework, not a data chart.
1. Platform certifications that match your stack. If you run a Microsoft environment, look for current Microsoft credentials: a partner designation, certifications held by the people who will do the work, or both. They are a signal, not a pass mark: a small specialist can be strong without the designation. Expired certifications, or certifications for platforms you do not use, tell you what they sell rather than what you need.
2. References you can actually telephone. Not case studies on a website. Named contacts at companies comparable to yours in size, sector and data complexity. A global banking logo does not help a 180-person distributor.
3. Advice that is not tied to one platform. A firm recommending the same tool regardless of context is selling its comfort zone. Ask which platform they would not recommend for your use case, and why. A specific, reasoned answer is a good sign; a diplomatic non-answer is not.
4. AI claims with a working demonstration. Many firms now offer “AI-powered analytics.” Ask to see it running on realistic data (synthetic, anonymised, or a client’s with that client’s permission) rather than on a slide. Do not expect a firm to open another client’s environment to you; one that offers to has told you something about how it would treat yours. Switching on a feature the platform vendor shipped is a legitimate thing to do. It is simply not the same as building something, and the price should reflect which one you are getting.
5. A written enablement plan. How many training sessions, in what format, for which roles, and on what date does your team run the system unaided? If training appears as a single line with no hours attached, it is a placeholder.
6. Named people, not named grades. Some firms sell with senior consultants and deliver with juniors. Ask for the names and backgrounds of the people who will do the work, and for notice in writing if they change mid-project.
7. Completed exits they can name. Can they point to clients now running the solution independently? That is the most direct evidence that their model transfers ownership. A long managed-service relationship is not a problem in itself if the client chose it and could leave at a known cost. If no client has ever left, that is the product.
Signals six and seven carry most of the weight at mid-market scale, because a 500-person company often has no BI team waiting to inherit a platform. The system lands with an operations manager or a finance controller who already has a full workload, and an engagement that ignores who will actually operate the result is planning for a handover that never happens.
One check is a gate rather than a signal. Before any of your data moves, ask where it will be stored and processed, which subcontractors will touch it, how access is granted, logged and removed, and how incidents are reported. Where the GDPR applies and the firm will process personal data for you, Article 28 requires a binding contract or other legal act, in writing, setting out how it does so.
Nine contract clauses that limit vendor lock-in
Lock-in is rarely imposed. It accumulates, through terms nobody negotiated because the build was going well. These nine will not remove every dependency: your choice of cloud platform and licenses creates its own, but they are worth settling before signature, while you still have leverage.

Lock-in is rarely imposed. It accumulates through terms nobody negotiated because the build was going well.
Unexplained pushback on the first four describes a business model: useful to know before signature.
Conceptual framework, not a data chart.
| # | Clause | What the contract should say |
|---|---|---|
| 1 | IP ownership | You own the code, data models, transformation logic and dashboards built for you, with no license-back requirement. The firm’s pre-existing tools stay its own and third-party parts keep their licenses, but the terms must let you, or a replacement firm, keep running and changing everything that was built. |
| 2 | Data portability | Your data, models, metadata, transformation logic, configurations and access mappings can be exported in open, documented formats on request, throughout the engagement and for a defined period after it ends. |
| 3 | Documentation as a deliverable | Architecture, data lineage, transformation logic and runbooks are named deliverables with acceptance criteria, not “provided as appropriate.” |
| 4 | Source access | Production environments sit in your own tenant or cloud accounts, with named administrators on your side from day one, not at handover; the firm gets the least access its work needs. |
| 5 | Enablement hours | A stated number of training and paired-working hours, with a named date by which your team operates the system without the firm present. |
| 6 | Key-person continuity | Named individuals, with written notice and your approval required for substitution. |
| 7 | Exit assistance | A defined transition period at agreed rates, with a knowledge-transfer scope, whether the engagement ends on schedule or early. |
| 8 | No proprietary dependencies | Anything built on the firm’s own tooling or frameworks is disclosed up front, with the license terms that apply after the engagement ends. |
| 9 | Acceptance criteria per deliverable | What “done” means for each item, agreed in writing, so that the final invoice is not the first conversation about scope. |
None of these is an exotic request, though the wording will depend on the firm’s own tools, third-party licenses and your security rules. A firm that pushes back hard on the first four without a reason, or offers terms no replacement firm could work with, is describing its business model, and you learn that before signature rather than eighteen months into a retainer.
Your first 30 days: from longlist to signed statement of work
Each step ends in an artifact you can show someone, not a feeling.
The paid pilot shows how a firm works in ways a reference call cannot. Agree beforehand what it should prove.
Conceptual framework, not a data chart.
| Days | What you do | What you finish with |
|---|---|---|
| 1–5 | Write the decision you are trying to make faster, and list the systems holding the relevant data | A one-page problem statement, not a feature list |
| 6–10 | Build a longlist of six to eight firms; check certifications and sector fit against the seven trust signals | A shortlist of three or four |
| 11–15 | Issue one standardized request to the whole shortlist | Comparable submissions, due on one date |
| 16–22 | Score against fixed weights; telephone two references per firm | A ranked shortlist with the reasoning written down |
| 23–27 | Negotiate the nine clauses with your top two; scope a short paid pilot on a real problem | Terms agreed before commitment |
| 28–30 | Sign a statement of work covering the pilot, with the full engagement contingent on it | A small, reversible first step |
Thirty days is a fast track that assumes legal, security and onboarding checks run alongside these steps; where they cannot, let the dates stretch rather than skip a check.
Steps 11 through 22 are where buying processes tend to lose their footing, because proposals arrive in incompatible formats and scoring becomes an argument about impressions. Fix the weights before submissions arrive. The companion guide sets out a scoring rubric and standardised request format in full: five dimensions: technical competence, industry and process fit, delivery track record, enablement and handover, team quality and continuity, with cost compared only among firms that clear a quality bar.
The paid pilot in the final week is, in our view, the most valuable part of this sequence. Two weeks of real work on a real problem shows how a firm handles your data, your people and its own estimates in ways a reference call cannot, and a firm confident in its delivery should be willing to scope one. Agree beforehand what the pilot should prove, which data it may use, what counts as done and who decides whether to continue. It will not prove that the full build holds up in production. Reluctance to scope something that small can mean the commercial model needs large contracts to function, which is useful to know now. If you are not yet sure what the pilot should tackle, an assessment can come first; that is a different thing from a pilot, and it is the shape of our Discovery package.
Frequently asked questions
What do business intelligence consulting services typically cost?
Clutch’s 2026 average hourly bands for BI firms run from under $25 in the Philippines to $100–$149 in the United States, Canada and Australia, and it gives $10,000 to $49,999 as the typical project band on its platform. Treat these as orientation, not a quote: a low hourly rate can still cost more in total if discovery takes longer.
How long does a BI implementation take?
The state of your source data is often a bigger schedule risk than the dashboard layer, and access approvals, agreeing metric definitions and security review add time of their own. In our own published packages, an assessment and roadmap takes two to four weeks and an implementation two to six months; other firms draw these lines differently. Ask for a data profiling exercise before anyone commits to a date: a proposal that promises a delivery date without having looked at your data has priced an assumption.
Do we need a data warehouse first?
Not always, and a firm that answers this the same way for every client is not answering. Smaller, simpler architectures are often the right call for a mid-market company, because they can be maintained by the people you already employ.
Is it cheaper to hire offshore?
On an hourly basis, usually yes: Clutch’s average bands differ by more than four times between the cheapest and most expensive countries it lists. Those bands follow where a firm is based, which is not always where its delivery team sits, so ask. Whether it is cheaper in total depends on how much of the work needs same-day iteration with your staff. Discovery and enablement are the phases where time-zone overlap matters most; build phases tolerate distance better.
How do we know the engagement actually worked?
Set the test at the start and make it behavioral: a named person outside the project team makes a specific recurring decision using the system, without asking anyone for help. Adoption metrics and satisfaction scores are easier to collect and easier to flatter.
What if we already have dashboards nobody uses?
That is a common and fixable starting point, and it often points to a trust problem rather than a tooling one. Begin by finding out why people went back to their spreadsheets: frequently the numbers disagreed with something they knew to be true. Our guide to dashboard design covers the reasons adoption stalls.
The short version
The firms that look most impressive in a pitch are not reliably the ones that leave you stronger, and the difference is visible in advance: in whether the enablement plan has hours attached, in whether the nine clauses are agreed without a fight, in whether they can name a client who no longer needs them.
Foundations (data quality, governance, the people who will run the result) are the least exciting thing to sell and among the most expensive to skip.
If you have proposals in hand, the fastest useful step is to score them against a fixed rubric rather than reread them. If you would rather settle what you need before anyone proposes a build, a gap assessment of where your reporting stands today is where our Discovery package starts: two to four weeks, with industry benchmarking, quick-win recommendations and a prioritized roadmap among the outputs. If the question is narrower than either of those, describe what you are choosing between and we will reply with the questions we would ask first.
Independence note: Veralytiq has no commercial relationship with any vendor named in this article.
Related Articles
- Business Intelligence Services: What to Expect in 2026 — An overview of business intelligence services
- BI Strategy & Roadmap: A Complete Guide for Dutch Mid-Market Companies — Frameworks, roadmaps and tools to turn data into decisions
Sources
Analyst research
- Gartner, Gartner Forecasts Worldwide IT Spending to Grow 14.2% in 2026, Totaling $6.37 Trillion, 27 July 2026.
- Gartner, Gartner Says Organizations with Successful AI Initiatives Invest Up to Four Times More in Data and Analytics Foundations, 16 April 2026. The release cites a global survey of 353 data, analytics and AI leaders, November–December 2025.
Regulation
- Regulation (EU) 2016/679 (General Data Protection Regulation), Article 28, processor.
Market and rate data (commercial platforms; the public pages do not give enough methodology to reproduce the figures)
- Clutch, Business Intelligence & Data Analytics Pricing Guide 2026, updated 21 September 2026, accessed 25 September 2026.
- YunoJuno, BI Consultant Contractor Rates 2026, based on YunoJuno booking data, accessed 25 September 2026.
- Verified Market Reports, Business Intelligence (BI) Consulting Provider Services Market, page last updated 23 April 2026, accessed 25 September 2026.
- Fortune Business Insights, Business Intelligence Market Size & Share, page updated 7 September 2026.
- Precedence Research, Business Intelligence Market Size, page last updated 12 August 2026, accessed 25 September 2026.