





Enterprise business intelligence is reporting and analysis run across many teams, business units or countries, where the same numbers have to mean the same thing to people who never meet. Much of the advice about it is advice about mid-market business intelligence with larger numbers in it. That misses what actually changes.
What changes is that the hardest problems become organisational as well as technical, and that the standard remedies contradict each other. Centralize and you create a queue. Federate and you get four definitions of revenue. Neither is wrong; both have costs that show up at scale, and the research on which is better is more equivocal than either camp admits.
This guide covers the operating model (definitions, governance, usage and cost), what the evidence supports, and which widely quoted numbers rest on old or anecdotal sources. Security, lineage and query performance also get harder at scale, but need their own technical review.
In this guide, enterprise means organizations with 250 or more employees (the EU’s large-enterprise threshold) and mid-market roughly 50 to 249; the working test is functional, whether several teams publish reports independently from the same data. Much of the research cited is international rather than Benelux-specific.
On this page
- What actually breaks above mid-market scale?
- Centralised, federated, or mesh?
- Why governance programmes fail
- What drives the cost of running enterprise BI?
- Which widely quoted numbers rest on old sources?
- How to sequence an enterprise BI programme
- Frequently asked questions
Key Takeaways
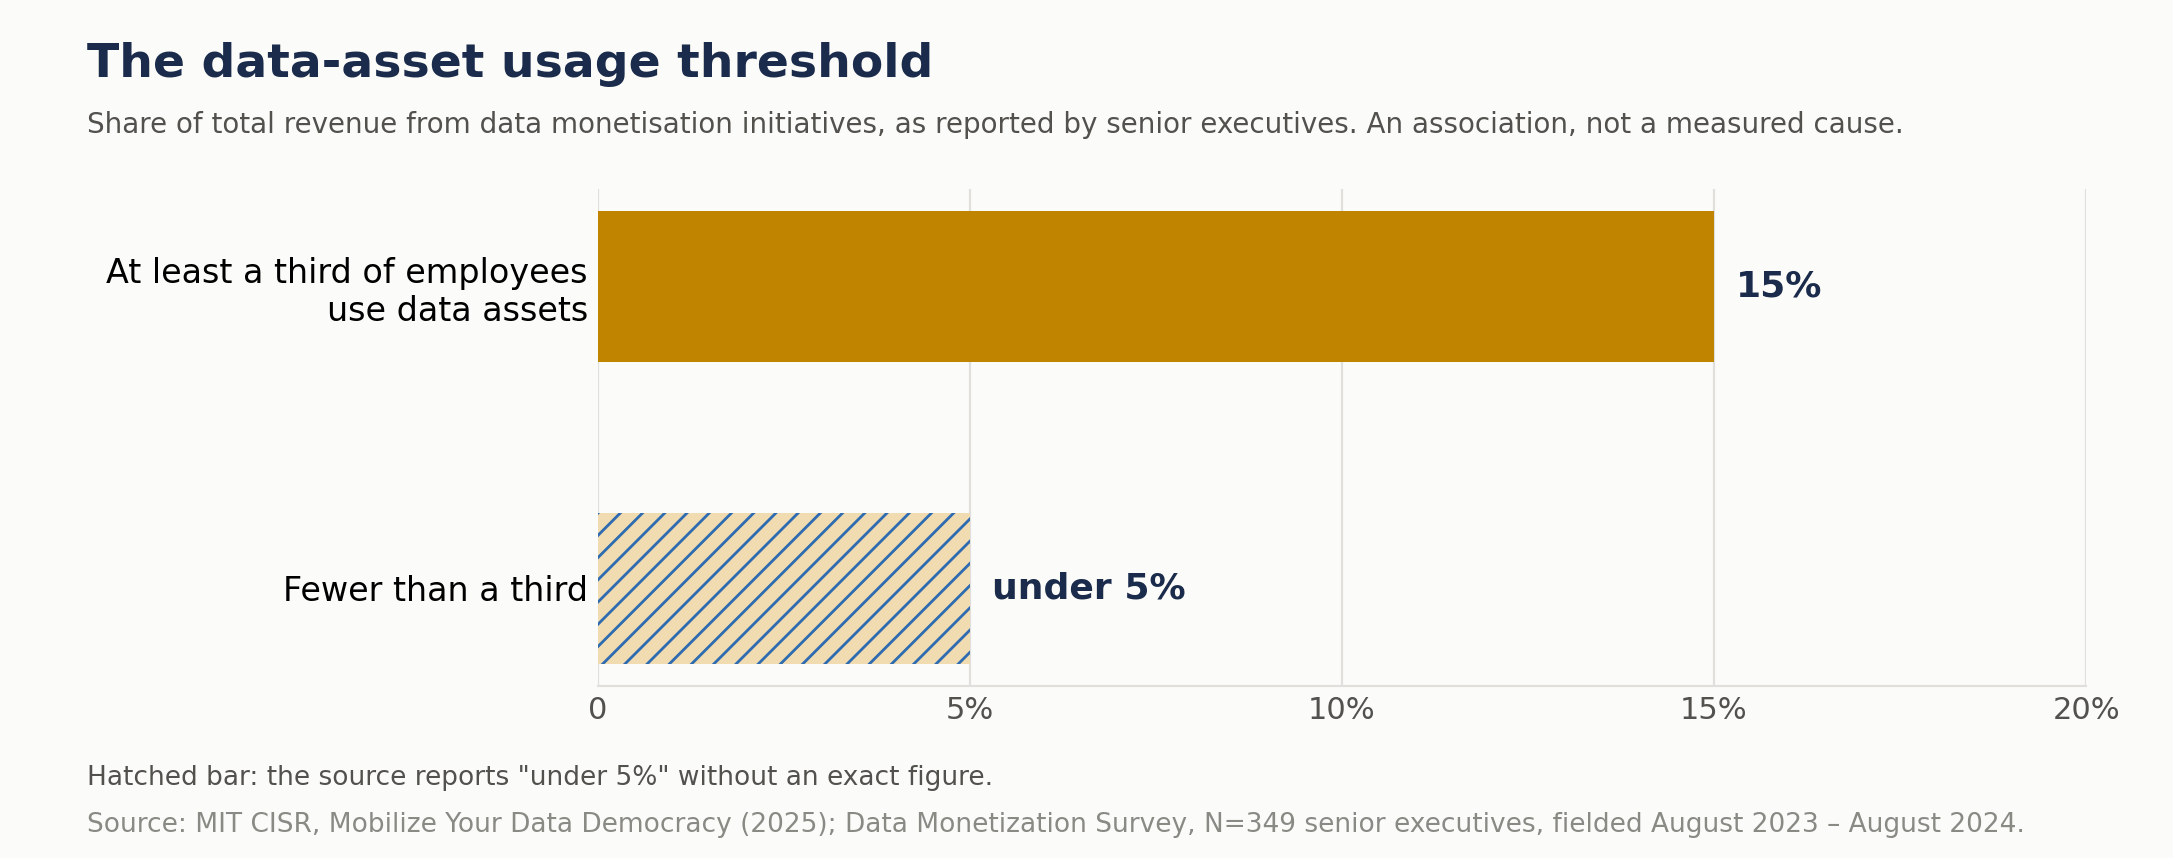
- Executives in MIT CISR’s 2024 survey (N=349) put average use of reusable data assets at 28% of employees. Where at least a third used them, data monetization initiatives accounted for 15% of revenue, against under 5% where fewer did: a comparison of two groups, not evidence of cause.
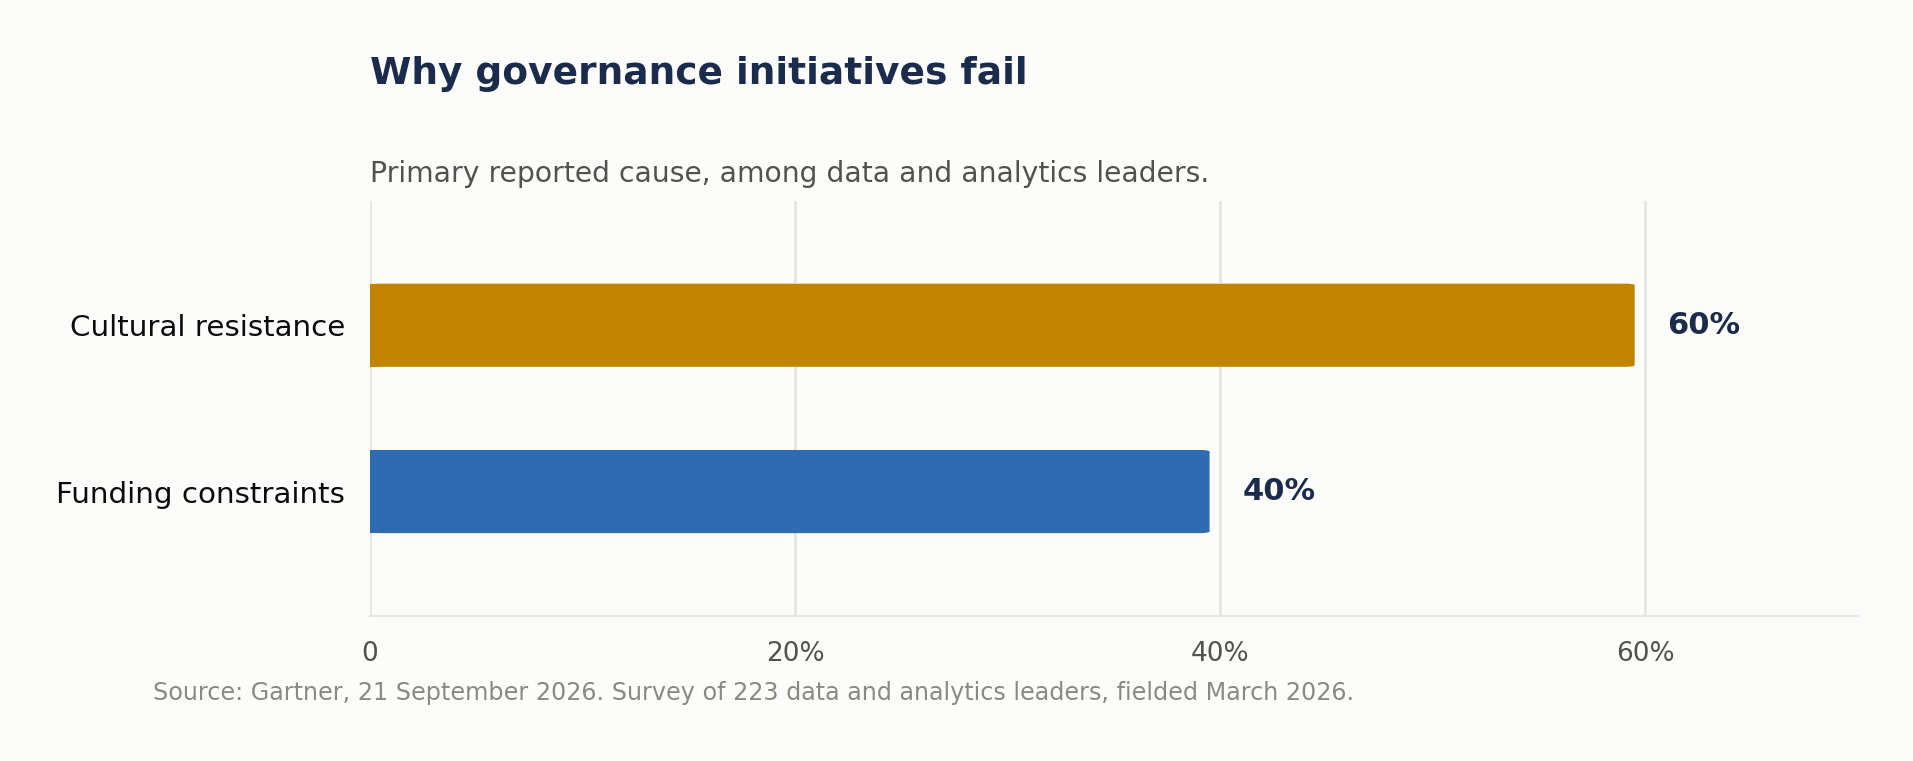
- In a March 2026 Gartner survey of 223 data and analytics leaders, cultural resistance outranked funding constraints as the primary reason governance initiatives fail, 60% against 40%.
- A 2025 structured review of 189 articles found no single correct architecture: each approach offers benefits suited to different contexts.
- A 2025 interview study of ten large Swiss organizations found most banks and insurers keeping governance centralized to balanced, larger banks decentralising data ownership, and no single adoption path.
- In the FinOps Foundation’s 2026 survey (1,192 respondents), data cloud platforms and AI were the most actively managed SaaS and platform as a service (PaaS) cost areas, linked to fast-scaling, less predictable spend.
- Two widely quoted enterprise BI statistics (the $12.9M cost of poor data quality and “fewer than 20% of knowledge workers use enterprise BI”) trace to 2020 Gartner research and a 2019 Forrester blog post that calls its figure anecdotal.
What actually breaks above mid-market scale?
Three failure modes recur, plus a fourth cost that sits on top of them.
Definitions multiply. Once more than one team can build a report, “revenue,” “active customer” and “margin” acquire variants. Each variant is defensible in its own context, and they rarely reconcile. This is the problem a semantic layer exists to solve: a shared place where business logic is defined once and consumed everywhere. Gartner’s April 2025 note on the subject frames analytics silos as undermining trust and consistency, and names semantic layers as a key component for unifying data across diverse use cases. That is an analyst opinion rather than a measured finding, and worth reading as directional.
Usage stays low. MIT CISR’s Data Monetization Survey of 349 senior executives, fielded between August 2023 and August 2024, found that only an average of 28% of employees draw on reusable data assets. The same research compares two groups: in organizations where at least a third of employees use such assets, data monetization initiatives account for 15% of total revenue, against under 5% where use is lower. Both are executives’ estimates from one survey. The one-third line is a grouping rather than a tested threshold, and the gap is an association, not proof that wider use causes the return.
Cost becomes non-obvious. While BI sits with one team, its cost is often budgeted mainly as licenses. As it spreads, more of the bill becomes compute, storage, egress, orchestration, observability and the engineering time to manage them, and much of that grows with usage rather than with headcount, which is a different budgeting problem.
There is a fourth thing that is not a failure mode so much as a tax: reconciliation meetings. When two teams arrive with different numbers for the same quantity, the organization spends senior time deciding which is right rather than deciding what to do.
That time rarely appears in a business case because few organizations log it, and we know of no study that measures it; in our view it is one of the largest recurring costs of disagreement. It is also a cost that a platform purchase does not remove on its own: buying a faster way to produce two irreconcilable numbers produces them faster.
Centralized, federated, or mesh?
The choice between centralized, federated and mesh takes up much of an enterprise BI program‘s time, and the research finds no general winner.
A structured literature review of 189 articles, published in Information Systems and e-Business Management in July 2025, concludes that each approach “offers unique benefits tailored to the application contexts.” Centralized structures (data platforms, data fabrics) deliver control, accessibility and streamlined management; decentralised structures (data mesh, data spaces) prioritize flexibility. In data-platform work specifically, the authors note, citing earlier research, a recurring “trade-off between openness and control.”
A second 2025 study, interviewing senior executives at ten large Swiss organizations across banking, insurance, industrial services and energy, found something more specific and more useful:
| Finding | What the study observed |
|---|---|
| Governance leans central in banking and insurance | Most banks and insurers took a “rather centralized to balanced” approach to governance, which the authors link to regulated firms wanting control and less downside risk |
| Ownership differs with size | A medium-sized bank kept ownership central; larger banks decentralised it for scalability, and tended to decentralise governance too |
| No standard path exists | No “silver bullet” adoption process; it depends on context |
Two variables the Swiss study links to adoption choices. The placement of options is our reading, not a study finding.
Governance and ownership move independently. Most banks and insurers studied kept governance centralized to balanced; larger banks decentralised ownership.
Conceptual framework, not a data chart.
The practical reading is that governance and ownership are separate decisions; across the sample, governance grew more centralized while ownership mostly stayed where it was. Centralized governance with federated ownership (a small group owning definitions, standards and the semantic layer, with domain teams owning their pipelines and reports) is one option this leaves open, not a pattern the study found winning. It fits MIT CISR’s description of a center of excellence that “coordinates data knowledge across the organization, setting standards.”
If you take that option, in our view the central group should own as little as it can: the metric definitions, the conformed dimensions, the access model and the standards that make domain outputs comparable. The rest can sit with the people who understand the data, unless regulation or thin domain capability makes that unsafe. A central team that also builds every report has recreated the queue the federated model was meant to eliminate.
The four options in the framework above, as a checklist (our reading, not a study finding):
| Option | Tends to fit when | Watch for |
|---|---|---|
| Keep it simple | One analytics function, lower regulatory exposure | A second team publishing reports to leadership |
| Centralize both | Higher regulatory exposure; one team keeps up with demand | The queue, once more teams need reports |
| Central governance, federated ownership | Higher regulatory exposure; domains can run their own pipelines | Domains without the skills or time to own them |
| Federate with a standards body | Lower regulatory exposure; capable domains using mostly their own data | Unenforced standards, so definitions drift again |
Why governance programs fail
Governance programs fail for a different reason than budget conversations assume.

Gartner’s September 2026 release, based on a survey of 223 data and analytics leaders fielded in March 2026, found that cultural resistance outweighs funding constraints as the primary reason governance initiatives fail, at 60% against 40%. The accompanying prediction is that by 2027, 60% of organizations that fail to address the cultural challenges of data and analytics governance will fail to govern AI successfully.
A related Gartner finding, from a global survey of 353 data and analytics and AI leaders fielded in November and December 2025, is that organizations reporting successful AI initiatives invest up to four times more as a percentage of revenue in foundational areas such as data quality, governance, AI-ready people and change management than those experiencing poor outcomes from AI. Only 39% of technology leaders were confident that their enterprise’s current AI investments would have a positive impact on financial performance.
Read together: organizations reporting AI success invest more, relative to revenue, in foundations that include people and change management, and the leaders surveyed name culture ahead of money as what stops governance working. A governance program that consists of buying a catalog tool and assigning stewards as a secondary duty covers the tooling and little of the rest.
What drives the cost of running enterprise BI?
As of 3 October 2026, we found no credible, current benchmark for the total cost of running enterprise BI; it depends heavily on scope. The useful evidence is about what drives it, and the best of it comes from the FinOps Foundation, whose annual survey is large and discloses its composition.
The 2026 edition drew 1,192 respondents representing over $83bn in annual cloud spend. Its relevant finding: among SaaS and PaaS categories, data cloud platforms and AI are the most actively managed cost areas, specifically because of “rapidly scaling spend, less predictable usage patterns, and emerging pricing models that don’t yet have established optimization playbooks.”
The 2025 edition (861 respondents, roughly $69bn in public cloud spend) expected governance and policy at scale to become the top priority within twelve months. In 2026 FinOps for AI took the top forward-looking spot instead and optimization stayed the top current priority, though governance, scope, alignment and forecasting together now outweigh it.
“Grows with usage” is easiest to see in a warehouse that bills per query. An illustration, not a benchmark: BigQuery’s on-demand price in Iowa (us-central1) is $6.25 per TiB scanned, with the first TiB each month free per account. A dashboard whose query scans 200 GiB and refreshes every hour runs 720 times a month: 140.6 TiB, or about $879 in gross query charges.
Filter the same query to a partition that holds the last week, say 5 GiB, and the month comes to 3.5 TiB, about $22. (Cached results are free, so this assumes the table changes between refreshes. The free TiB is shared across the account’s queries; if this dashboard had it all, the charges would be about $873 and $16.) No one was hired and no license changed; one design decision cut the data scanned, and the gross charge, fortyfold. On capacity (slot-hour) pricing, the saving shows up as freed slot time instead.
As of 3 October 2026, we looked for a credible, current figure on unused BI seats or on the cost of query sprawl at enterprise scale and did not find one.
The nearest analogues are enterprise-wide, and both come from vendors of SaaS and asset-management software: Zylo’s 2026 SaaS Management Index, built on more than 40 million licenses and $75bn of spend under management, reports that organizations leave an average of 36% of SaaS licenses unused, measured against recommended utilization levels; and Flexera’s 2025 State of ITAM survey of 506 IT professionals found 35% saying SaaS waste had increased over the past year. Neither isolates analytics tooling.
For your own estimate, price each line separately for defined workloads, region, retention and service level: licenses or capacity, query compute, storage, data movement, orchestration and observability, support, and the engineering, governance and enablement time that sits in salaries rather than on an invoice. A query example like the one above is not a benchmark.
Which widely quoted numbers rest on old sources?
Several enterprise BI statistics are still quoted as if current, without their date or the quality of the evidence behind them. Three are worth naming, because you are likely to hear them in vendor meetings.
“Poor data quality costs organisations $12.9 million a year.” This appears on Gartner’s own site, which attributes it to “Gartner research from 2020.” The page does not give the method or sample, and we found no newer Gartner figure. It may still be roughly right; we found no current evidence either way.
“Fewer than 20% of knowledge workers use enterprise BI.” The live source we found is a July 2019 Forrester blog post on BI market consolidation, which presents it as “anecdotal evidence.” We found no newer Forrester data behind it.
“X% of IT and transformation projects fail.” Usually attributed to the Standish CHAOS report. As of 3 October 2026, we could not find its full methodology published in a form that can be reviewed, and its definition of a failed project has been criticised in the academic literature, for example by Eveleens and Verhoef in The Rise and Fall of the Chaos Report Figures. It is also not analytics-specific in any version.
A fourth: we could find no rigorous, dated, BI-specific study on why enterprise BI consolidation or migration programs overrun. Applying general digital-transformation overrun figures to analytics consolidation is an assumption, not a finding. If a vendor cites a migration-duration statistic, ask which study it comes from.
None of this makes the underlying risks imaginary. It means we found no current, BI-specific rate for data-quality losses, adoption or migration overruns fit for a business case; your own baseline (reconciliation effort, who uses what, how your last migration ran against plan) is a better guide. Where a business case does rest on a published number, that number should have a current, dated source, and in this category several of the most load-bearing ones do not.
How to sequence an enterprise BI program
No study we found tests an order for these steps. What follows is our synthesis of the failure modes above, a starting sequence to test, and almost the inverse of a platform-first program.
Almost the inverse of a platform-first program.
The first thing worth buying at enterprise scale is usually agreement, and the documentation that makes it survive.
Conceptual framework, not a data chart.
- Settle definitions before architecture. The reconciliation problem is what makes enterprise reporting expensive, and no architecture solves a disagreement about what margin means. Done when the metrics leadership uses in the first decision area have agreed definitions and owners.
- Separate governance from ownership explicitly. Decide who owns definitions, standards and access, and who owns pipelines and reports. Write it down. In our view, conflating them is the structural mistake to avoid first. Done when every domain has a named owner and the central remit fits on one page.
- Put shared metric logic in one governed place. Usually that is a semantic layer, the contract between those two groups that lets domain teams move quickly without producing incompatible numbers; where one team and one tool dominate, certified shared models may do for now. Done when reports take the agreed metrics from that place instead of recalculating them.
- Instrument usage from day one. Given that wider use goes with higher reported returns, and that the 28% baseline is low, not measuring who uses what leaves you unable to tell whether the program worked. Done when you have a usage baseline and a count of reconciliation disputes.
- Treat cost as a managed variable, not a license line. Consumption-based analytics spend needs ownership and a forecast, and the FinOps data shows practitioners still building playbooks for data platforms while that spend grows. Done when platform spend has an owner and a monthly forecast checked against the bill.
For organizations at the front of this, knowing where definitions and ownership stand today is, in our view, a more useful first deliverable than a platform selection. Our shortest published package, two to four weeks, covers a current-state and gap assessment and a prioritized roadmap; with the scope agreed that way at the start, it can serve as a current-state review of where your definitions and ownership diverge. The data foundation page describes the definitions-and-ownership work. If you are earlier than this and still choosing a partner, the buyer’s guide covers what to ask for.
Frequently asked questions
At what size does BI become an “enterprise” problem?
There is no universal headcount or revenue line. A practical warning sign is when more than one team can independently publish reports that leadership sees, from overlapping data; that is when definitions tend to diverge, and it can happen well below the size associated with enterprise software. It is a rule of thumb, not a measured cut-off.
Is data mesh better than a centralized warehouse?
The review covering 189 articles describes benefits suited to different contexts rather than a ranking: centralized structures deliver control, decentralised ones flexibility. The Swiss study found no single adoption path either. Treat anyone presenting either model as the answer with caution.
Do we need a semantic layer?
If more than one team builds reports against the same data and the definitions have already diverged, you need one governed place for shared metric logic. A semantic layer is the usual way to provide it, and the case grows when several tools reuse the same measures. With one analytics team, one main tool and one set of definitions, certified shared models and a metric glossary may be enough for now. The trigger is organisational, not technical.
How do we measure whether enterprise BI is working?
Start with usage (who runs what, how often) and reconciliation (whether two teams asked the same question produce the same number); both are measurable from day one. Then add measures tied to the program’s purpose, such as time to an agreed number for a recurring decision, data freshness against agreed service levels and cost per active user. Dashboard count measures inventory, not use. Our note on adoption and value covers what the adoption research can and cannot tell you.
Should governance be a separate team?
The evidence supports treating governance as a decision separate from delivery, which is not the same as a separate department. In the Swiss study the two varied independently; a small central group owning definitions and standards, with domain teams delivering against them, is one way to act on that.
How long should an enterprise BI program take before it shows anything?
As of 3 October 2026, we found no benchmark, so this is a planning view. A program whose first visible output is a platform go-live nine months out has no feedback loop, and no way to discover that a definition was wrong until it is expensive to change.
In our view a definition inventory and one reconciled metric belong in the first weeks, with six to eight as a working target that source access, stakeholder availability and the number of systems will move. That surfaces disagreements early, when they cost a meeting rather than a rebuild.
What scale actually changes
This article recommends no vendor and no single architecture. It does recommend governing shared metric logic in one place and making ownership explicit; how you do that should follow your regulation, size and domain capability.
The sources cited here measure different things, and none compares whole operating models by their results. Taken together, they put organisational variables alongside architecture: whether definitions are agreed, whether governance and ownership are separated, whether anyone is measuring usage, whether cost has an owner. The architecture debate that takes much of the attention turns out, in the literature we reviewed, to be a trade-off with no general answer.
The practical consequence is that the first thing worth buying at enterprise scale is usually not a platform. It is agreement, and the documentation that makes agreement survive the people who reached it.
Independence note: Veralytiq has no commercial relationship with any vendor named in this article.
Related Articles
- How to Choose a Business Intelligence Tool: The Portability Test — A practical way to choose the right BI platform
- BI Strategy & Roadmap: A Complete Guide for Dutch Mid-Market Companies — Frameworks, roadmaps and tools to turn data into decisions
- SQL for Business Intelligence: The Silent Wrong Answers — SQL skills behind BI reporting
Sources
Peer-reviewed
- Gieß & Hutterer, The Future of Data Management: A Delimitation of Data Platforms, Data Spaces, Data Meshes, and Data Fabrics, Information Systems and e-Business Management 23, 971–997, published 16 July 2025. 1,485 documents identified, 189 articles in the final corpus.
- Winter & Hackl, Exploring Data Mesh Adoption in Large Organizations, Issues in Informing Science and Information Technology 22, 2025. Interviews with senior executives at ten large Swiss incumbents.
- Eveleens & Verhoef, The Rise and Fall of the Chaos Report Figures, IEEE Software 27(1), 2010.
Analyst research and academic centres
- Gartner, 60% of organizations that ignore data governance culture challenges will fail to govern AI successfully by 2027, 21 September 2026. 223 data and analytics leaders, fielded March 2026.
- Gartner, Organizations with successful AI initiatives invest up to four times more in data and analytics foundations, 16 April 2026. 353 leaders, fielded November–December 2025.
- Gartner, Rethink Semantic Layers to Support the Future of Analytics and AI, 8 April 2025. Analyst research note, qualitative; no sample disclosed.
- MIT Center for Information Systems Research, Mobilize Your Data Democracy, van der Meulen, Someh, Wixom & Beath, 18 September 2025. Based on the 2024 MIT CISR Data Monetization Survey, 349 senior executives, fielded August 2023 – August 2024.
Trade bodies, vendor documentation and platform data
- FinOps Foundation, State of FinOps 2026, 1,192 respondents representing over $83bn in annual cloud spend.
- FinOps Foundation, State of FinOps 2025, 861 respondents representing approximately $69bn in public cloud spend.
- Google Cloud, BigQuery pricing, on-demand query pricing, Iowa (us-central1), checked 25 September 2026.
- Zylo, 2026 SaaS Management Index, 29 January 2026. More than 40 million licences, $75bn in spend under management; all SaaS categories; vendor data.
- Flexera, 2025 State of ITAM, 18 June 2025, 506 IT professionals; vendor survey.
Claims we checked and did not use
- “Poor data quality costs $12.9 million a year”: Gartner’s data-quality page, 2020 research. “Fewer than 20% of knowledge workers use enterprise BI”: a Forrester blog post of 24 July 2019. “X% of IT projects fail”: Standish CHAOS. Why we did not rely on them is set out under “Which widely quoted numbers rest on old sources?” above.
- “Semantic layers cut analytics costs by 50% and deliver projects 4x faster.” From a July 2022 AtScale press release about its own product category, based on a self-reported survey of about 100 existing semantic-layer users, with no comparison group.
- Any figure for BI seat utilisation, the cost of query sprawl or BI-specific migration overruns. We found none with a named, dated study and disclosed methodology behind it.