





Most writing about the business intelligence analyst role is written for people who want to become one. This is written for the person deciding whether to hire one.
That is a different question, and it has a specific trap in it. In many organizations the first BI analyst ends up being more than an analyst. They can become the person who builds the pipelines, defines the metrics, maintains the reports, answers the ad-hoc questions and explains the numbers in the leadership meeting: several jobs, one person, and no one to check their work.
This guide covers what the role involves according to the US occupational classification rather than job adverts, what the labor-market data supports, and how to think about the hire-versus-contract-versus-buy decision when the evidence for each is thinner than you would expect.
In short: three questions decide it. Is the work continuous or a defined gap, does it need one skill or several, and who will check the numbers? Continuous work with a narrow skill set points to a hire, a defined gap points to a contractor, and a need for breadth with built-in review points to an external team.
On this page
- What does a BI analyst actually do?
- What the labour data says, and what it cannot
- The statistic everyone quotes about analyst time
- Hire, contract, or buy?
- What does each option actually cost?
- The one-analyst problem
- How to test a candidate properly
- Frequently asked questions
Key Takeaways
- The US system has no separate wage or employment series for “BI analyst”. O*NET files the role as a specialty within Data Scientists and reports that occupation’s figures in its wage box.
- US median pay for the parent occupation was $120,230 in May 2025, with employment of 275,600, projected growth of 35% between 2025 and 2035, and about 24,800 openings a year.
- As of 3 October 2026, we found no time-to-fill figure specific to analytics roles with a disclosed method. The US job openings survey does not collect occupation, and SHRM’s 2026 benchmark puts the median at 39 calendar days for nonexecutive roles across all functions.
- The “analysts spend 80% of their time cleaning data” claim rests on a 2014 newspaper range (50–80%, from interviews and expert estimates) and a 2016 vendor survey of about 80 data scientists. Neither measures how analysts divide their time.
- The role’s highest-rated task in the US occupational profile is generating reports for executives and managers. Worth matching against what you actually need.
- A single analyst is a single point of failure. The nearest quantified analogue for that risk comes from software repositories rather than analytics teams.
What does a BI analyst actually do?
Job adverts are marketing documents, so the more useful source is the occupational classification.
O*NET files Business Intelligence Analysts as a specialty within the Data Scientists occupation, at Job Zone Four: most occupations in the zone require a four-year degree, though some do not, and usually several years of work-related experience or training. That describes the occupation, not a requirement for your vacancy. It rates 17 tasks by importance. The eight highest-rated, abridged, describe a role that is considerably more operational than the title suggests:
| Task (abridged) | Importance |
|---|---|
| Generate standard or custom reports for executives and managers | 91 |
| Maintain or update business intelligence tools, dashboards and databases | 84 |
| Manage the timely flow of business intelligence information to users | 80 |
| Provide technical support for existing reports and dashboards | 74 |
| Analyze industry or geographic trends for strategy implications | 72 |
| Document specifications for business intelligence outputs | 68 |
| Create business intelligence tools or systems, including related databases | 68 |
| Collect business intelligence data from industry reports and purchased sources | 67 |
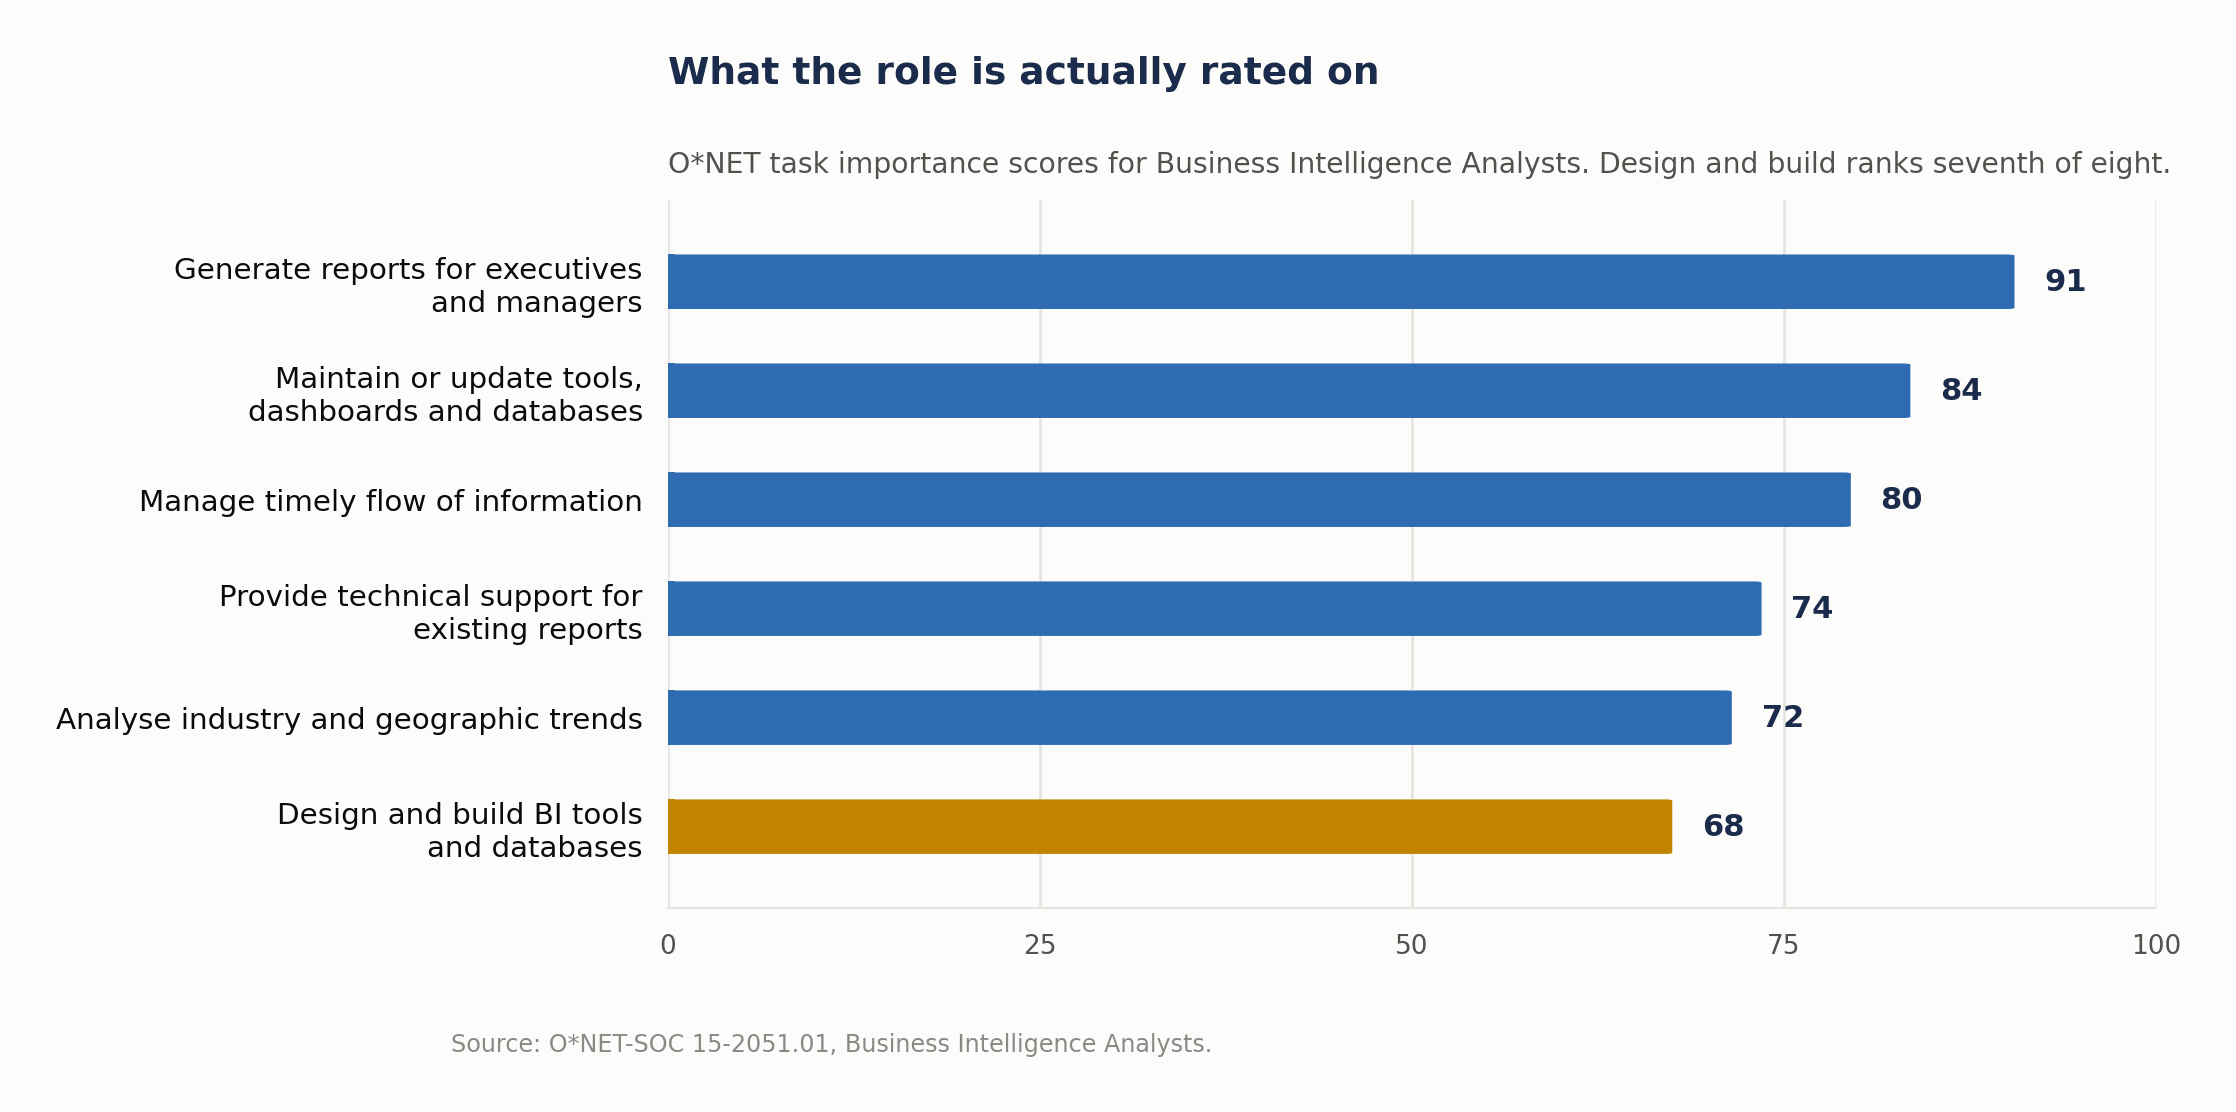
The top four are reporting, maintenance, distribution and support. Creating tools and databases scores 68, tied sixth on score and seventh in O*NET’s list order. Importance ratings are not a time budget, so this does not tell you how the hours split. It does tell you what the occupation is organized around. If what you need is someone to build a data foundation that does not yet exist, you are hiring for a part of the profile that ranks below the reporting and upkeep work, so treat it as an engineering-heavy requirement and test for it explicitly.
What the labor data says, and what it cannot
There is no separate US wage or employment series for business intelligence analysts. O*NET files the title under Data Scientists (SOC 15-2051), and the wage box on the BI analyst page is headed “Median wage data for Data Scientists”. The published figures are therefore the parent occupation’s, from the BLS Occupational Outlook Handbook:
- Median annual pay $120,230 (May 2025), employment 275,600, projected growth 35% between 2025 and 2035 (an increase of 95,400 jobs), and about 24,800 openings a year on average over the decade.
Depending on how an employer frames the job, similar work can also sit closer to Computer Systems Analysts (SOC 15-1211), whose reported O*NET titles include business systems analyst. It is a different occupation, with median pay of $105,850, employment of 544,400, projected growth of 8% and about 32,900 openings a year. Two occupations, a pay gap of about $14,400 and a projected growth rate more than four times higher for data scientists. They are not a salary range for BI analysts: which occupation a job resembles is a judgment call, and it moves the benchmark a long way.
In the EU the granularity is coarser still. Eurostat counts 10.45 million ICT specialists across the EU in 2025, 5.0% of total employment, with annual growth slowing from 4.5% (2023–24) to 2.6% (2024–25). The release has no breakout for data analysts; the role sits inside the broader ICT specialist definition. In the Netherlands, CBS puts the 2024 median gross hourly wage for ICT occupations at €33.50, across 465,000 employees.
On time-to-hire, there is no role-specific figure we could use. The main US government survey of vacancies, JOLTS, does not collect occupation information; it reports openings and hires by industry, region and establishment size. The nearest legitimate benchmark is a professional body’s survey. SHRM’s 2025 benchmarking brief, based on 2,371 responses from a random sample of active SHRM members (not weighted), put the median at 44 calendar days for nonexecutive roles and 45 for executive roles. Its 2026 update reports 39 calendar days for nonexecutive roles, with executive roles unchanged. Neither has an analytics breakout.
Treat six weeks or so as a broad reference across all functions, not a plan: build your own figure from recent hires, location, seniority and approval steps, add notice period and onboarding separately, and ask for the method behind any role-specific number you are quoted.
The statistic everyone quotes about analyst time
You will hear that analysts spend 80% of their time cleaning data. The trail behind it is instructive.
Two different sources tend to get merged. The older is a 2014 New York Times article that put data scientists’ time spent collecting and preparing data at 50 to 80%, “according to interviews and expert estimates”: a range, not a measurement. The one usually cited for the figure itself is CrowdFlower’s 2016 Data Science Report, a vendor publication. Its chart, headed “How a Data Scientist Spends Their Day”, shows 60% for cleaning and organizing data and 19% for collecting data sets. Those two add to 79%, which became “80%”.
Two things limit what that can carry. Contemporary coverage in Forbes put the sample at about 80 data scientists. And the report describes the result as what respondents “spend the most time doing”, so we could not tell whether respondents picked one task or estimated shares of their week. Those are different quantities, and others have made the same point.
The trail behind ‘analysts spend 80% of their time cleaning data’.
The share of people naming a task is not the share of time spent on it. The survey’s own sample size was never disclosed.
Conceptual framework, not a data chart.
So the claim is either an estimated range or a rounded sum from a small vendor survey with an ambiguous measure. It may be directionally true, but it is weak support for a business case.
As of 3 October 2026, we could not find a credible, sampled measurement of how BI analysts divide their time. If the number matters to your own business case, measure your team over a representative period that includes a reporting peak, with the categories defined in advance.
Hire, contract, or buy?
Since the labor data does not settle this, the decision has to turn on structural fit. Three questions separate the options usefully.
Every option claims capability. These are the dimensions where they genuinely diverge.
One option is sequencing rather than choosing: build externally, then hire into a role that operates something that already works.
Conceptual framework, not a data chart.
Is the work continuous or does it end? Reporting, maintenance and support, the top four tasks in the occupational profile, are continuous. Building a data foundation, migrating a warehouse or standing up a first reporting layer ends. Hiring a permanent person for work that ends can leave a role that has to be reinvented afterwards, unless maintenance and new work follow; contracting for work that is continuous tends to produce a dependency.
Do you need one skill or four? The first analytics hire usually needs data engineering, modeling, visualization and stakeholder management. Those rarely coexist at a strong level in one mid-level hire, and a senior person who genuinely has all four is expensive and hard to attract to a team of one. An external team may cover the range, if it actually staffs those roles; an individual covers the part they are strongest at, and the rest tends to get done less well. With a small, stable stack, a genuinely hybrid first hire can still work if you decide which skills they own and which get reviewed elsewhere.
Who checks the work? This is the question that gets skipped. A single analyst’s numbers are unreviewed by anyone qualified to review them. Many reporting errors are silent, so the absence of a second pair of eyes is a real quality risk rather than a theoretical one.
“Contract” and “buy” each cover more than one arrangement, and they carry different risks:
| Route | What you get | Who checks the work | Tends to fit |
|---|---|---|---|
| Permanent hire | Continuity and growing context | No one, unless you arrange it | Continuous reporting and upkeep |
| Individual contractor | One person for a set period | You, if you have the expertise | A defined gap with an end date |
| Staff augmentation | Supplier staff working under your direction | You | Extra capacity where standards already exist |
| Outcome-based external team | A team accountable for an agreed deliverable | The supplier, then you at acceptance | Work that ends, such as a first data layer |
Labels vary, so ask suppliers for named roles, who reviews whose work and the exact deliverables.
One option is sequencing rather than choosing: use external capacity to build the foundation and set the standards, then hire into a role that operates and extends something that already works. That works when the scope includes access to all code, documented metric definitions, joint working and a dated handover, and fits poorly when the work is continuous from day one or the supplier keeps the operating knowledge. If that is the route you want, our packages page describes a two-to-six-month build that includes change management support, which is the stage to finish before the first analyst starts.
If you are weighing an external partner, the selection rubric covers how to score one, and the buyer’s guide covers what the work costs.
What does each option actually cost?
Pay varies enormously by market, and the published figures cover a broader role than most people mean. But the shape of the cost differs between the options, and the comparison is routinely made wrong.
The mistake is comparing a salary against a day rate. A permanent analyst’s cost is salary plus employer contributions, recruitment, equipment, tooling and management time, spread across a year in which some weeks are productive and some are onboarding, holiday or waiting for data access. A contractor or partner costs a day rate for days worked, with no cost between engagements. Those are different units, and dividing one by the other produces a number that flatters whichever side you were already leaning towards.
An illustrative calculation, not a benchmark. Start from the US median for the parent occupation, $120,230. In June 2026, wages and salaries were 70.0% of employer compensation costs in private industry, so $120,230 in wages implies roughly $171,800 a year in pay and benefits before recruitment, tooling or management time. For a Dutch reference point, CBS’s €33.50 median hourly wage for ICT occupations, multiplied by 36 hours and 52 weeks, gives about €62,700; CBS’s hourly figure excludes special payments (bijzondere beloningen) and pay for holiday hours, so treat that only as an indication. Replace every input with your own: your salary band, your employer on-costs and the share of the year you expect to be productive.
A more useful comparison than rate against rate is cost per delivered outcome over a defined period. Ask what you need to exist in twelve months, such as a reliable set of reports, a modeled data layer or a team that can extend it, and price each route against that. List the same lines for each route: pay and on-costs or supplier fees, recruitment or procurement, onboarding, realistic productive capacity, tooling, your management and review time, handover, and work left uncovered. Label your own inputs, official benchmarks and assumptions separately.
The published data does point to rising demand: BLS projects 35% employment growth for the parent occupation to 2035. That is a demand projection, not a measure of candidate supply, so it cannot tell you how hard the hire will be in your market or what to budget.
The one-analyst problem
As of 3 October 2026, we could not find a study of key-person risk in analytics teams. There is a good one in software, and the mechanism transfers closely enough to be worth citing carefully.

A peer-reviewed study of 133 popular GitHub projects found that 65% had a “truck factor” of two or fewer: 34% at one and 31% at two. The truck factor is the number of people who would have to leave before a project is in serious trouble. The authors asked the projects’ developers to check the results: 67 projects responded and 62 were analyzed. In 84% of the valid answers developers agreed or partly agreed that the people identified were the main authors, but only 53% gave a positive or partly positive answer on the truck factor estimate itself.
That is software repositories, not analytics teams, and it should be read as an analogy rather than a measurement of your situation. But the structural conditions are similar: undocumented logic, accumulated context, and a small number of people who know why something was built the way it was. A single analyst who has built two years of reporting logic is in much the same position.
The mitigations are unglamorous and cheap relative to the risk. Metric definitions in version control rather than in the tool. A written data dictionary. Transformation logic in SQL files rather than in dashboard-level calculations. A quarterly exercise where someone else re-runs a report from the documentation. None of this requires a second hire; all of it converts tacit knowledge into something transferable.
How to test a candidate properly
Given that the expensive failure mode is a silently wrong number, the interview should test for that rather than for tool familiarity.
- Give them a small, genuinely messy extract and ask what is wrong with it. Put real problems in it: duplicate rows from a bad join, a nullable column used in a filter, two date formats, a category that changed name mid-period. What they notice unprompted is the signal. Use synthetic or anonymised data, the same brief for every candidate, a fixed hour or so, and a scoring rubric written before the first interview.
- Ask them to explain a metric to a non-technical stakeholder. The highest-rated task is producing reports for executives. If they cannot explain a calculation without jargon, that task will go badly regardless of their SQL.
- Ask what they would need from you. A candidate who says they need nothing has probably not run a project. Data access, a decision-maker who responds, time from the people who understand the source systems: a good answer names these.
- Ask about a number they got wrong. Most people in this field have shipped a wrong figure. What matters is whether they found it themselves, how, and what they changed afterwards.
- Skip the algorithm puzzle unless the job involves algorithm design. It is not among the tasks O*NET lists for the role, and a work sample that mirrors the real job tells you more.
Frequently asked questions
What is the difference between a BI analyst and a data analyst?
In practice the titles overlap heavily, and in the US system neither has its own wage series. Where organizations do distinguish them, BI analyst tends to mean reporting and dashboard work against a modeled data layer, and data analyst tends to mean ad-hoc investigation. Write the job description around the tasks you need rather than the title.
Do I need a data engineer before a BI analyst?
Often, but not always. If source data is fragmented or refreshes need dedicated ownership, secure engineering capacity, permanent or external, before or alongside the analyst, or they may spend their first year doing engineering alone. With a small, stable stack and a genuinely hybrid candidate, one person can cover both for a while.
Is it cheaper to hire or to use a consultancy?
It depends on whether the work continues, and the comparison is usually made wrong, as above. For continuous, well-used capacity over several years a permanent hire can be cheaper; check it against local employment costs, productive time, expected tenure and real supplier quotes. For work that ends, it may leave you with a role to reinvent. Where the conditions above hold, sequencing avoids having to choose.
What should a first analytics hire be able to do on day one?
Write SQL against unfamiliar schemas, notice when a number is implausible, and explain a calculation to someone who does not want to know how it works. Tool familiarity usually comes faster than those three, so weight them more heavily unless the job needs a specific platform from the first week.
How do I know if the analyst I have is doing well?
Whether anyone acts differently because of their work. Dashboard counts and ticket throughput measure activity. A decision that changed, a number that got corrected before it reached a board pack, a process someone stopped doing by hand: those measure the job.
What the decision actually turns on
The labor statistics cannot answer this question. There is no separate BI analyst series to look up, no role-specific time-to-fill with a disclosed method, and the most-quoted productivity statistic in the field turns out to rest on an estimated range and a small vendor survey.
What is left is structural, and it is more useful anyway. Is the demand temporary or continuous? Which skills must one person own, and which will be supplied or reviewed elsewhere? And who checks the numbers, given that unreviewed numbers tend, sooner or later, to be wrong in ways no one notices?
Decide those three first. The staffing model tends to follow from them without much further argument.
Independence note: Veralytiq has no commercial relationship with any vendor named in this article.
Related Articles
- SQL for Business Intelligence: The Silent Wrong Answers — SQL skills behind BI reporting
- Business Intelligence Adoption: The Number That Decides — Why adoption decides whether a BI investment pays off
Sources
Official statistics and occupational classification
- US Bureau of Labor Statistics, Data Scientists, Occupational Outlook Handbook, last modified 27 August 2026, May 2025 wage data.
- US Bureau of Labor Statistics, Computer Systems Analysts, Occupational Outlook Handbook, last modified 27 August 2026.
- US Bureau of Labor Statistics, Employer Costs for Employee Compensation – June 2026, released 9 September 2026. Private industry: wages and salaries 70.0% of employer costs.
- US Bureau of Labor Statistics, JOLTS Frequently Asked Questions: “JOLTS does not collect occupation information.”
- O*NET OnLine, Business Intelligence Analysts, 15-2051.01, updated 2026. Also Computer Systems Analysts, 15-1211.00, sample job titles.
- Eurostat, Number of ICT specialists in the EU continues to grow, 27 May 2026.
- CBS, 85517NED, hourly wages by occupation: ICT occupations 2024 median €33.50, 465,000 employees. The hourly wage excludes special payments.
Peer-reviewed
- Avelino, Passos, Hora & Valente, A Novel Approach for Estimating Truck Factors, 24th IEEE International Conference on Program Comprehension (ICPC), 2016.
Professional bodies
- SHRM, 2025 Recruiting Executives Benchmarking: Insights to Maximize Recruitment, data brief. 2,371 active SHRM members, random sample; not weighted.
- SHRM, 2026 Recruiting Executives Benchmarking: Attracting Critical Talent.
The 80% claim
- Steve Lohr, For Big-Data Scientists, ‘Janitor Work’ Is Key Hurdle to Insights, The New York Times, August 2014: “interviews and expert estimates”, 50 to 80%.
- CrowdFlower, 2016 Data Science Report (copy hosted by the University of Houston).
- Gil Press, Cleaning Big Data: Most Time-Consuming, Least Enjoyable Data Science Task, Survey Says, Forbes, 23 March 2016. Sample reported as about 80 data scientists.
- Leigh Dodds, Do data scientists spend 80% of their time cleaning data? Turns out, no?, 31 January 2020.
Claims we looked for and did not use
- Any role-specific time-to-fill for data or analytics positions with a disclosed method. The US vacancy survey does not collect occupation, and the professional-body benchmarks above report all functions together.
- Any published attrition or “failed hire” rate for analytics roles. We did not find one with a disclosed sample and methodology.