





Finance works with some of the most disciplined data in any organization: double-entry bookkeeping, a method more than five centuries old, requires every entry to balance. The reporting and planning layer on top of it often still runs on spreadsheets. In the FP&A Trends Survey 2024, Excel was the main planning application for 52% of organizations.
That gap is the subject of this guide. Financial business intelligence here means the data, models and reports that turn ledger and planning data into the figures finance and leadership rely on: the month-end close, management packs, budgets and forecasts. (For banking and insurance analytics, see financial services.) The guide also checks which widely quoted figures hold up when you follow them to the source.
One finding shapes the rest: the most thoroughly measured error rate we found that bears on finance reporting is not in the enterprise resource planning (ERP) or the dashboard. It is in the spreadsheets between them.
In short: build the production reporting layer last. Inventory the spreadsheets behind each reported figure, move the highest-consequence calculations into a tested model, measure where the close days actually go, and only then automate the pack. Where to begin depends on the symptom: a late close starts with measurement, corrected figures start with the workbooks.
On this page
- How long should a close take?
- Where does finance time actually go?
- What is the error rate in the spreadsheet layer?
- How often do reported numbers turn out wrong?
- Can analytics improve forecast accuracy?
- Where to start in a finance reporting build
- Frequently asked questions
Key Takeaways
- In September 2026, American Productivity & Quality Center (APQC)’s open cross-industry benchmark (measure 104615) showed a median monthly financial close of 8.0 days across 3,389 organizations. The open page does not show quartiles, a collection period or whether the days are calendar or working days.
- In Raymond Panko’s compilation of field audits, 24% of 367 operational spreadsheets had at least one detected error; the later audits, with better methods, found errors in 91% of 54. In lab experiments where people built spreadsheets alone, the average cell error rate was 3.2% across 547 spreadsheets in nine studies.
- Among companies reporting to the US Securities and Exchange Commission (SEC), material (“Big R”) restatements occurred at a rate of around 3% per year on average over 2005–2024, according to the Public Company Accounting Oversight Board (PCAOB).
- The “75% of time gathering data” figure is real research on financial planning and analysis (FP&A) teams, but the fieldwork is from 2018–19 and it is often recycled without the date.
- As of 3 October 2026, we did not find a credible cross-company benchmark for internal forecast error. A peer-reviewed review of 130 studies on management earnings forecasts sets out what drives accuracy rather than one error rate.
- In a 2024 practitioner survey, organizations describing their data quality as high were more than three times as likely to rate their own forecasts good or great as those with low data quality (71% against 21%). The gap between users and non-users of AI or machine learning was smaller: 65% against 40%.
How long should a close take?
The benchmark used here is APQC’s Open Standards Benchmarking measure 104615, cycle time in days to complete the monthly financial close. It is scoped to the “Perform general accounting” process and nine sub-processes, from maintaining the chart of accounts and processing journal entries to intercompany reconciliation, consolidation and eliminations, the trial balance and management adjustments.
Across 3,389 organizations, cross-industry, the median is 8.0 days (as shown in September 2026; the live sample can change).
That is a reasonable reference point, with caveats. The open page shows the median only: the quartile columns are blank for visitors who are not logged in, and no collection period is given. APQC also publishes a second close-related measure, and the two are easy to confuse:
| APQC measure | What it times | Unit | Median | Sample |
|---|---|---|---|---|
| 104615, monthly financial close | The close within “Perform general accounting” (the nine sub-processes above) | “Days”; calendar or working not stated | 8.0 | 3,389 |
| 100162, monthly consolidated financial statements | From running the initial monthly trial balance to completing the consolidated statements | Calendar days, weekends included | 6.0 | 11,223 |
The two clocks start and stop at different points, so the 6.0 is not a faster version of the 8.0. As of 3 October 2026, we could not verify the “top performers close in four days” line that appears in finance-transformation marketing, so we are not repeating it. If a vendor quotes a close benchmark, ask which APQC measure it comes from and when the data was collected.
A close cycle also only means something alongside what is being closed: a single-entity company with one currency and one ERP is not running the same process as a group consolidating twelve subsidiaries across four currencies with intercompany eliminations. The cross-industry median pools organizations of very different complexity, and the open page does not show how the sample splits across them. Before treating eight days as a target, work out where your own complexity is likely to put you in that distribution.
The more useful question than “how do we compare” is what the eight days consist of. A close can be slow without the accounting being hard, because of dependencies: waiting for a subsidiary’s submission, waiting for an accrual estimate from operations, waiting for a reconciliation that one person performs manually, then re-performing part of it when a late adjustment lands. Whether that is true of your close can be measured: log task time, waiting time, rework and late adjustments for two cycles.
Automating pack production shortens the last mile: producing the pack once the numbers are final. On its own, it does little to the dependency chain that determines when the numbers become final. Tools that also automate reconciliations or close task workflows can reach further up that chain, so judge any tool against the measured causes of delay. A close-acceleration program that starts with pack automation risks working on the wrong end: the pack arrives sooner, but the numbers are final no earlier.
Where does finance time actually go?
You will see the figure “finance spends 75% of its time gathering data and 25% analysing it.” It comes from real research, and it deserves both a date stamp and a narrower description.
The source is a joint AFP and APQC study of more than 400 FP&A professionals, surveyed and interviewed between November 2018 and March 2019. Respondents reported that their FP&A teams spend 75% of their time gathering data and administering processes, down only two percentage points from 77% in 2010. The published summary does not break down the remaining quarter, so “25% on analysis” is an inference, not a finding. Only 22% of respondents described their analytics as predictive or prescriptive.
It is legitimate research, but it is about FP&A teams rather than all of finance, and it reflects fieldwork from 2018–19.
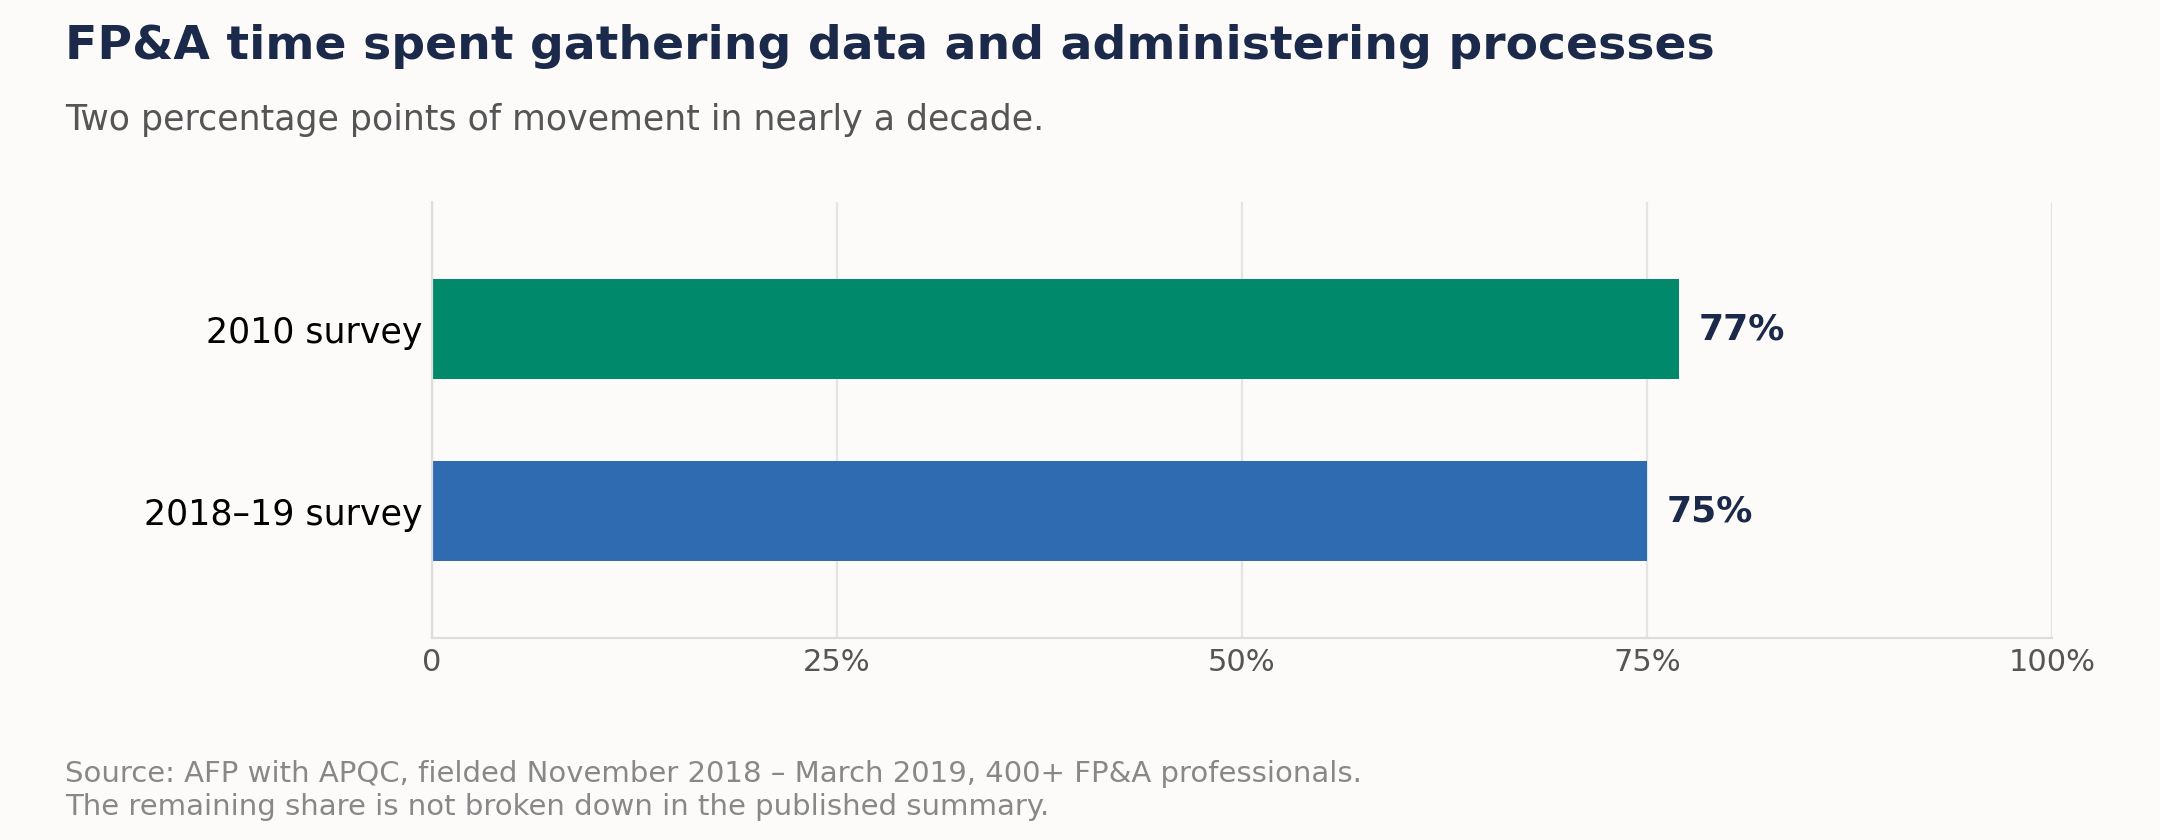
A more recent practitioner survey, the FP&A Trends Survey 2024 (383 respondents, published June 2024), reports a different split: 45% of FP&A time on data collection and validation against 35% on gaining insights and driving actions, a distribution it describes as stable over the past four years. Different question, different instrument and a smaller, vendor-sponsored survey, so the two are not directly comparable. What they share is narrower: collecting and preparing data still takes a large share of FP&A time.
| Study | Fieldwork and sample | Time on data collection | Time on insight and analysis |
|---|---|---|---|
| AFP and APQC | More than 400 FP&A professionals, surveyed and interviewed November 2018 to March 2019 | 75% gathering data and administering processes (77% in 2010) | Not broken down in the published summary; “25% on analysis” is an inference |
| FP&A Trends Survey 2024 | 383 respondents, published June 2024 | 45% on data collection and validation | 35% on gaining insights and driving actions |
As of 3 October 2026, we did not find a current, large professional-body measurement of this split that publishes the percentage in an accessible summary, so the broad pattern is well supported but its current size is not precisely known.
What is the error rate in the spreadsheet layer?
Spreadsheet errors have been studied for decades. Raymond Panko’s compiled research covers field audits of operational spreadsheets and controlled development experiments. The field-audit samples are old and small, and the spreadsheets are not all financial, although many of the audited ones were financial models. The two strands tell a consistent story:
| Measure | Result | Basis |
|---|---|---|
| Field audits finding at least one error, all audits | 24% | 367 spreadsheets, field audits compiled in Panko’s 2000 paper |
| Field audits from 1997 onward, with better methods | 91% | 54 spreadsheets (same paper) |
| Field audits since 1995, updated compilation | 88% | 113 spreadsheets in seven studies (2008 revision) |
| Cell error rate in individual field audits | about 0.4%–2.5% | 1.1%–2.5% in three large spreadsheets from two audits; 0.4% in an audit that inspected only higher-risk formulas |
| Average cell error rate, development experiments | 3.2% | 547 spreadsheets built by individuals working alone, nine studies (Panko’s summary) |

The field-audit rows are not independent measurements: the 54 spreadsheets are part of the 367, and the 2008 total of 113 includes the same 54. Panko links the gap between 24% and 91% to better audit methodology in the later studies, not to worse spreadsheets. That cuts both ways. Careful inspection finds more of what is there, so the 24% is likely to understate the problem. But the 91% and the 88% come from 54 and 113 spreadsheets audited between 1995 and 2007, so neither is an estimate for the spreadsheets in use today, and quoting “about 90% of spreadsheets contain errors” without that context overstates the evidence base. Most of the audits in the 2000 compilation also counted only substantive errors, not every error.
A cell error rate of a few percent compounds. As an illustration only: if each cell had an independent 3.2% chance of being wrong, a chain of thirty formula cells would contain at least one wrong cell about 62% of the time (1 − 0.968³⁰). That is not the probability that the reported figure is wrong: real errors are not independent, and some do not change the output. Panko warns that the rate is a long-term average, not accurate for any specific spreadsheet, and many of the experiments used students, so treat this as a sense of scale. The practical point stands: many spreadsheet errors are silent. A wrong range in a SUM produces a plausible number, not an error message.
These studies measured how often spreadsheets contain errors; they did not measure how much moving a calculation into a modeled, version-controlled layer reduces them. What such a layer can do is make controls enforceable: changes to the model are recorded and tests can run on every release, provided deployment is controlled and manual overrides are locked down or logged. It reduces risk only if the new model is reconciled to the ledger, tested against known results and reviewed by someone other than its builder. Done that way, it targets a problem whose size has actually been measured.
It also helps explain why errors survive review. Take structural errors: a range that stopped one row short when someone inserted a line, a hardcoded number where a reference should be, a formula copied across a row that should not have been relative. They do not look wrong on a read-through. In Panko’s review of error-reduction methods, the one technique then shown to work was cell-by-cell code inspection, which is slow to do.
The practical test for which calculations to move first is not complexity. It is consequence and silence: how far the number travels, and whether anyone downstream would notice if it were ten percent wrong. A figure that appears in a board pack and reconciles to nothing else is the first candidate.
How often do reported numbers turn out wrong?
The PCAOB’s October 2025 analysis of Audit Analytics data (generally excluding 1940 Act filers, benefit plans and 2021 SPAC-warrant restatements) finds that material (“Big R”) restatements occurred at a rate of around 3% per year across 2005 to 2024. A Big R restatement is disclosed on Form 8-K, Item 4.02: earlier statements should no longer be relied on. Also, an average of 29% of companies with Big R restatements had changed auditors in the prior year, against an 11% average auditor-change rate across the wider population.
Ideagen Audit Analytics’ May 2026 report, which covers SEC registrants and counts the less serious “little r” revisions as well as Big R restatements, puts 2025 at 391 restatements, down 18% from 477 in 2024. Only 2020 was lower in its 20 years of data. Accounting Today’s summary of the report gives 375 for 2020 and puts the share of companies restating in 2025 at 5.1%, without saying which company population that share is based on. The 2021 spike was not a general deterioration: after an SEC staff statement on warrant accounting, more than 1,000 restatements related to special-purpose acquisition companies (SPACs) were filed that year, against 13 in 2025.
| Source | Scope | What it found |
|---|---|---|
| PCAOB, October 2025 | Material (“Big R”) restatements, 2005 to 2024 | A rate of around 3% per year; on average 29% of companies with Big R restatements had changed auditors in the prior year, against 11% across the wider population |
| Ideagen Audit Analytics, May 2026 | SEC registrants; Big R and “little r” restatements | 391 restatements in 2025, down 18% from 477 in 2024; only 2020 was lower in 20 years of data |
| Accounting Today summary | Same report | 375 restatements in 2020; 5.1% of companies restating in 2025, without saying which company population that is based on |
For a private mid-market company (here, roughly 50 to 249 employees, the EU’s medium-sized band), or any company that does not file with the SEC, these figures are context rather than a benchmark, and they say nothing direct about error rates in private companies. What they show is that, among externally audited companies filing with the SEC, material errors still surface at around 3% a year. That is not evidence that less-scrutinized reporting does worse, but it is a reason not to assume it does better.
Can analytics improve forecast accuracy?
Possibly, but the published evidence we found does not measure the effect, and the survey data below shows associations, not causes.
As of 3 October 2026, we looked for a credible cross-company benchmark of corporate forecast error and did not find one. The most relevant academic work we found covers a different kind of forecast: a peer-reviewed 2022 review of 130 studies on management earnings forecasts (the guidance listed companies publish) synthesises what drives accuracy, such as firm size, prior accuracy, governance and analyst coverage, and does not report a consolidated error rate. Its search left out other corporate forecasts, such as cash flow and revenue. As of 3 October 2026, we found no industry MAPE for internal forecasts.
What exists is self-reported and should be labeled as such. In the FP&A Trends Survey 2024 of 383 practitioners, 42% rated their own forecasts good or great. Among organizations using AI or machine learning in forecasting the figure was 65%, against 40% for those not using it. The sharper contrast is data quality: 71% at organizations with high data quality, against 21% at those with low data quality. Data quality here is the respondents’ own description of their data (a single source with agreed definitions at the top, several sources whose definitions take time to analyze at the bottom), not an external measure. And the AI and machine learning group is small: only 6% of respondents were using AI or ML in forecasting, and the report gives no count or margin of error for that subgroup.
| Group (FP&A Trends Survey 2024) | Rated their own forecasts good or great |
|---|---|
| All 383 respondents | 42% |
| Using AI or machine learning in forecasting | 65% |
| Not using AI or machine learning | 40% |
| High data quality | 71% |
| Low data quality | 21% |
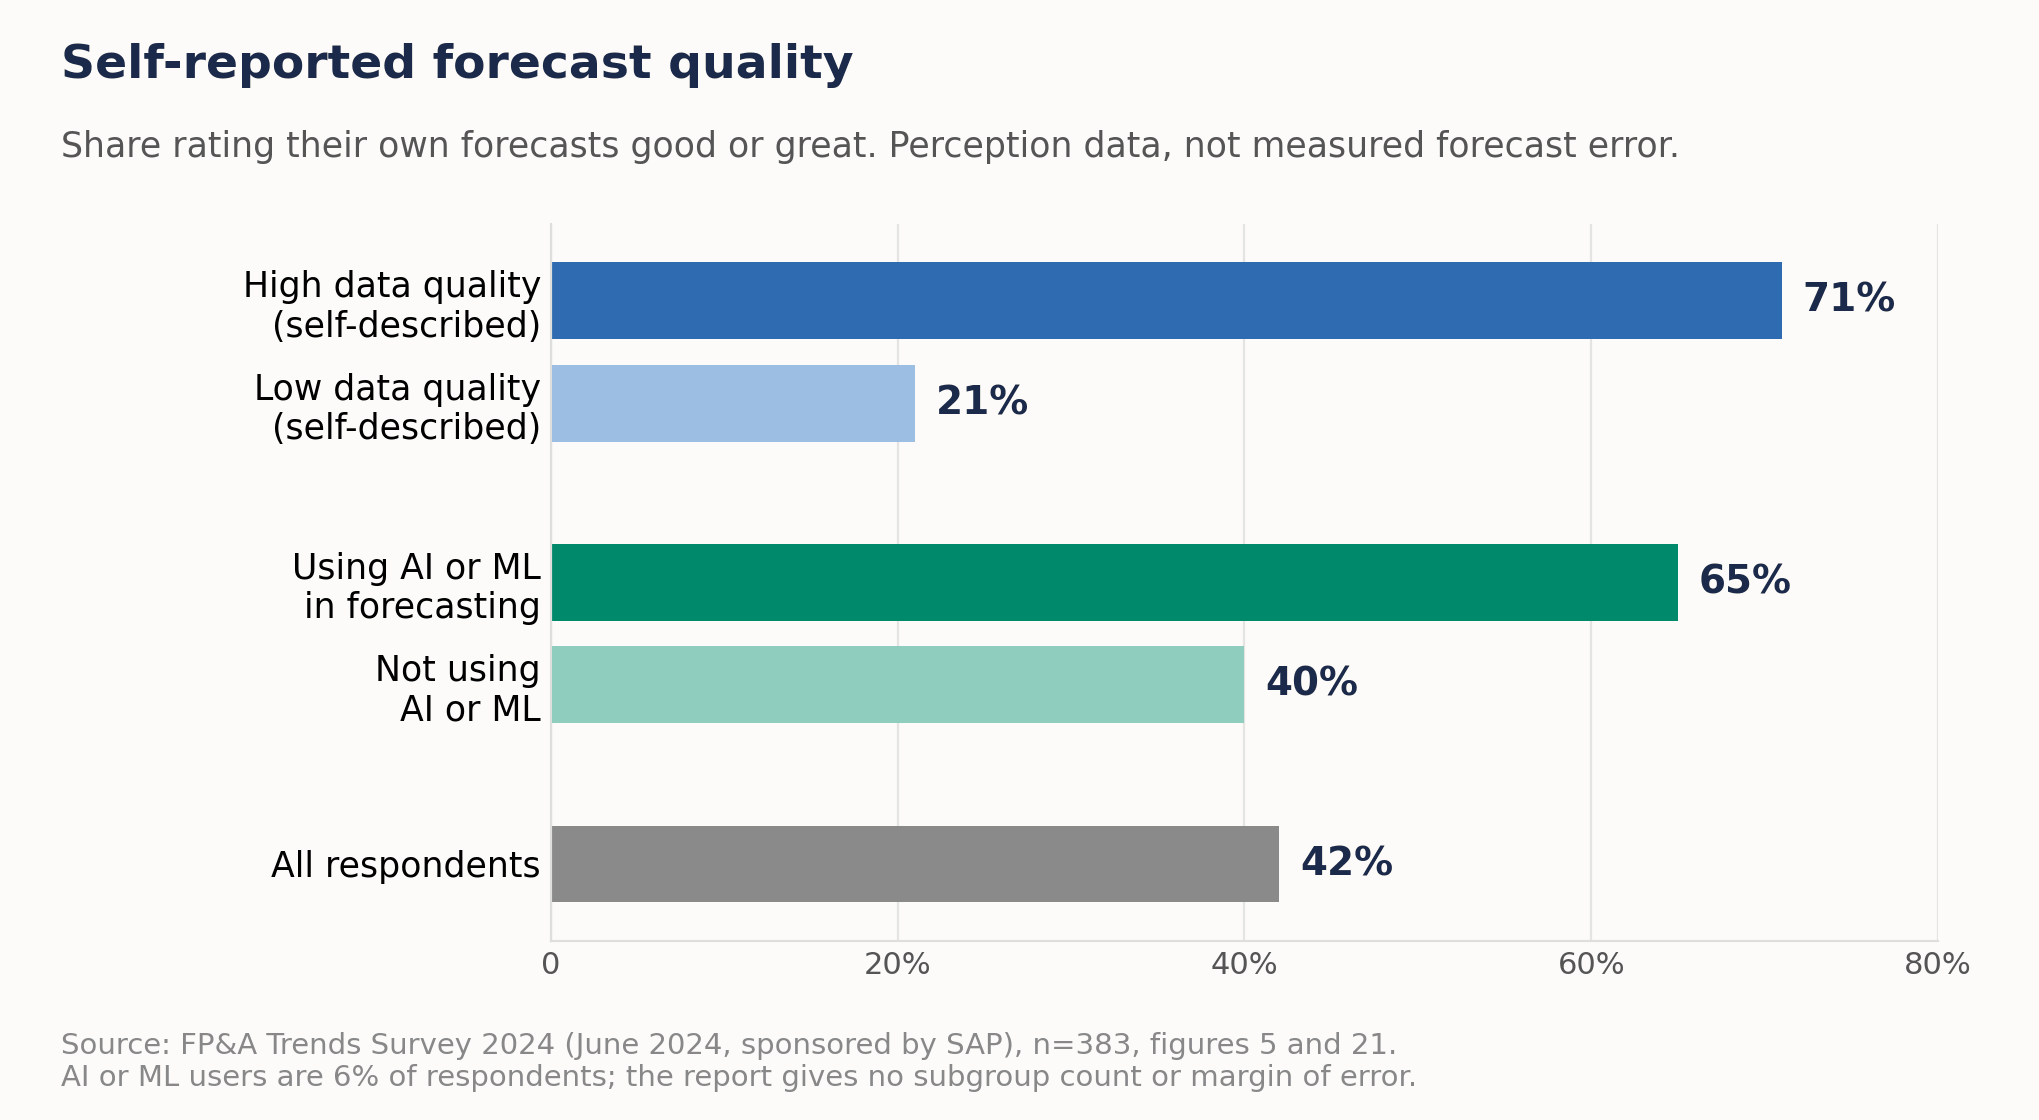
The data-quality contrast is more than three to one; the AI and machine learning contrast is about 1.6 to one. They are not quite like for like, since one compares the top and bottom of three data-quality groups and the other compares users with non-users, and the published figures do not separate the two effects. The association supports checking the input layer before buying a new method, but a one-off self-assessment cannot show cause and effect. A basic check covers the few drivers that dominate the forecast: are their inputs complete, defined the same way in every source, available on time and reconciled to the ledger or source system?
People who have invested in forecasting may rate their forecasts more highly, which is not the same as their forecasts being more accurate. As of 3 October 2026, we found no measured benchmark here, so a vendor quoting an industry forecast-error figure should be asked for the study.
Where to start in a finance reporting build
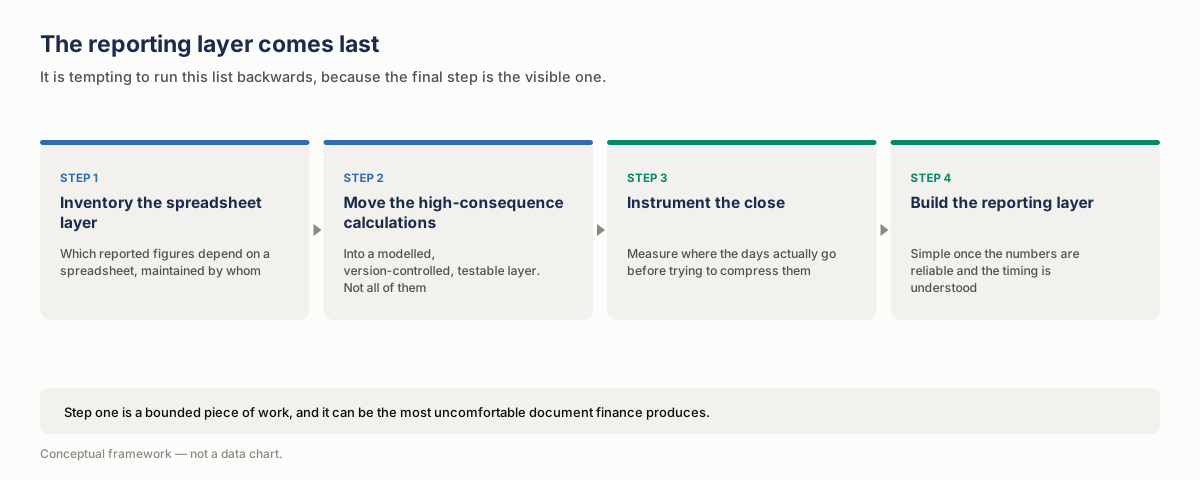
Read together, the evidence above suggests a sequence that puts the production reporting layer last. A thin prototype of the pack can still run alongside the early steps to test definitions and what its users need; what waits is the production build.

| Step | Action | What it involves | Why this order |
|---|---|---|---|
| 1 | Inventory the spreadsheet layer | For each reported figure: which workbook produces it, who maintains it, how often it runs, which reports it feeds, what it reconciles to, how many manual steps it involves, and what happens if that person is unavailable. Rank the list with the consequence-and-silence test above. | Its size depends on the number of entities, source systems and recurring workbooks, so scope it before estimating the effort. It can be the most uncomfortable document the finance function produces. |
| 2 | Move the highest-consequence calculations into a tested model | Not all of them, and not at once. Start with the ones where a silent error would reach a board pack. Sign each one off only when finance has approved the definition, the output reconciles to the ledger (or, for planning figures, to an agreed source) within an agreed tolerance, it reproduces known results including edge cases, access is limited to the right roles, and the previous version can be restored. | A silent error in a board pack is the costliest failure, so those calculations come first |
| 3 | Instrument the close | Measure where the days actually go: which dependency arrives late, which reconciliation is manual, which adjustment triggers rework. | It is hard to compress a cycle you have not measured, and the measurement is also the baseline for judging step four |
| 4 | Build the production reporting layer last | Once the numbers are reliable and the timing is understood, automating the pack is comparatively simple. | It is the part that demonstrates well but changes least |
The right first move depends on the symptom:
| If the main problem is… | Start with |
|---|---|
| The close finishes late | Step 3: measure where the days go |
| Reported figures get challenged or corrected after the pack goes out | Steps 1 and 2: trace those figures to their workbooks and reconcile them to the ledger |
| Figures are trusted, but the pack is assembled by hand | Step 4 may be the right first move |
| Forecasts are weak | The input check described in the forecasting section, before changing the method |
It is tempting to run the list backwards, because step four is the visible one. For an outside view before committing to a build, a current-state review of the spreadsheets and close timeline behind your board pack is the smallest published starting point: Veralytiq’s Discovery package, a two-to-four-week current-state and gap assessment ending in a roadmap with prioritized steps. If definitions, source mappings or data quality are unstable, treat that as a data foundation problem to fix before, or alongside, the reporting build.
Frequently asked questions
Is financial BI different from the rest of business intelligence?
Mainly in where the risk sits. It starts from structured accounting records, with balancing and reconciliation built into the routine. The weaker link is often the last mile: many of the numbers that reach leadership can pass through a spreadsheet layer with a measured error rate.
Should we replace spreadsheets entirely?
Usually not. Spreadsheets are excellent for exploration, one-off analysis and modeling a scenario nobody anticipated. The case for moving something out is specific: it is a recurring calculation, a reported figure depends on it, and an error in it would be silent. That is a much smaller set than “all spreadsheets.”
How much should a finance reporting project cost?
Scope drives it more than report count: the number of source systems, entities and currencies, how consistent the chart of accounts is, how much history you need, reconciliation and security requirements, refresh frequency and how much process change is involved. A credible estimate states these assumptions before it gives a range, which is why an assessment before implementation pricing is sensible. To compare quotes, ask each supplier to state them and to price discovery, source integration, data remediation, modeling and controls, report build, testing, training, licenses and ongoing support separately. On the benefit side, the inputs you can measure yourself are the hours spent on rework and pack assembly and the days the close spends waiting.
Can we shorten the close with better reporting tools?
Partly. Pack automation compresses the last step; tools that also automate reconciliations or close workflows can reach further. Much of the waiting may sit in the dependency chain, which is a process question. Measure task time, waiting time and rework across two closes before deciding which end to work on.
What about forecasting software?
The evidence does not support a confident answer. As of 3 October 2026, we found no published benchmark for corporate forecast error. In the self-reported survey data, forecast ratings differ sharply with data quality (71% against 21%) and less sharply with AI or machine learning use (65% against 40%), which makes fixing inputs before buying a method the more cautious order.
Who should own finance reporting definitions: finance or IT?
A workable split is that finance owns the definition, IT or data owns the implementation, and, where the team is large enough, neither owns both. Where one team has to do both, independent review and documented change approval fill the gap. The risk when IT owns definitions is technically correct numbers that answer a slightly different question than the one asked. The risk when finance owns implementation is the spreadsheet layer this article is about.
The layer between the ledger and the board pack
Even where the ERP is well controlled and the annual accounts are audited, the figures leadership sees each month can pass through a chain of workbooks with lighter ownership, testing and change control. Where the error rate of that layer has been measured, it runs from under 1% to a few percent of cells.
Finding out whether that is true in your organization needs no new tooling. Take the latest board pack, trace each figure to the workbook that produces it, and note who maintains it and what it reconciles to. It is the cheapest of the four steps above, and it shows where the other three should start.
Related Articles
- BI by Sector: A Complete Guide for Dutch Mid-Market Companies — Business intelligence use cases by sector
- Enterprise Business Intelligence: What Breaks at Scale — How business intelligence works at enterprise scale
- Building a KPI Dashboard: From Data to Insight — From data to a working KPI dashboard, step by step
Sources
Peer-reviewed and foundational
- Panko, Spreadsheet Errors: What We Know. What We Think We Can Do, EuSpRIG 2000. Field audits (Table 1): 24% of 367 spreadsheets; 91% of 54 audited from 1997 onward; cell-by-cell code inspection as the one proven error-reduction technique.
- Panko, What We Know About Spreadsheet Errors, revised May 2008 (archived copy). 88% of 113 spreadsheets audited in seven studies since 1995.
- Panko, Spreadsheet development experiments. Individuals working alone: nine studies, 547 spreadsheets, overall cell error rate 3.2%.
- Preussner & Aschauer, The Accuracy and Informativeness of Management Earnings Forecasts: A Review and Unifying Framework, Accounting Perspectives 21(2), 2022. Review of 130 studies.
Oversight bodies
- PCAOB, Data Points: Financial Restatements and Auditor Turnover, October 2025. 2005–2024, using Audit Analytics data.
- Center for Audit Quality, Ten years of restatement trends, covering 2013–2022.
Professional bodies and benchmarking consortia
- APQC, Cycle time in days to complete monthly financial close, Open Standards Benchmarking, measure 104615, 3,389 organisations, median 8.0 days, as shown in September 2026 (the page’s browser title refers to finance shared services centres; the measure shown covers the business entity).
- APQC, Cycle time in days to complete the monthly consolidated financial statements, measure 100162, 11,223 organisations, median 6.0 calendar days.
- Association for Financial Professionals with APQC, Five practices of highly effective FP&A teams, July 2019. Fielded November 2018 – March 2019, 400+ FP&A professionals.
- FP&A Trends Group, FP&A Trends Survey 2024, June 2024, sponsored by SAP. 383 practitioners; Excel the main planning application for 52% of organisations (Fig. 12); forecast ratings by data quality (Fig. 5) and with or without AI or ML, 65% against 40% (Fig. 21); 6% using AI or ML in forecasting (Fig. 13).
- ICAEW Library, The Earliest Books on Bookkeeping 1494 to 1683. Origins of double-entry bookkeeping, including Pacioli’s 1494 text.
Commercial data
- Ideagen Audit Analytics, Financial Restatements, May 2026. Coverage, per Ideagen’s database description: SEC registrants, Big R and little r restatements. 391 restatements in 2025, down 18% from 477; 13 SPAC-related restatements in 2025 against more than 1,000 in 2021.
- Accounting Today, Financial restatements drop 18%, 5 June 2026. Summary of the Ideagen report: 375 restatements in 2020; 5.1% of companies restating in 2025 (population not defined).
Claims we checked and did not use
Where an item says we did not find something, that describes our source review, not proof that no such source exists.
- APQC top-quartile close figures (“top performers close in four days”). Repeated by vendors citing APQC, but the quartile values are not shown on the open benchmark page and could not be independently verified. Only the median is reported here.
- “Finance spends 75% of its time gathering data and 25% analysing it” presented as current. The underlying fieldwork is from 2018–19, covers FP&A teams, and reports 75% on gathering data and administering processes; the 25% is not reported as analysis time. We cite it with the date and wording.
- “Around 90% of spreadsheets contain errors” without qualification. Close to the later field-audit figures (91% of 54; 88% of 113); the full historical sample of 367 shows 24%. The figures are given above with their basis.
- A single cross-company forecast error benchmark. We did not find a credible one. The peer-reviewed review of management earnings-forecast studies does not report a consolidated rate.
- A 70% “negative income impact” share for 2025 restatements. It appears in a trade summary of the Ideagen report, but the wording does not make clear what the 70% is a share of, so it is not used.
- An official aggregate late-filing rate. We looked for a current, freely published official statistic and did not find one.
- 2021 as the highest restatement count in 20 years. Accounting Today’s summary of the Ideagen report says so, but Audit Analytics’ own review of 2021, as reported by CFO Dive, described that year’s total as a 15-year high, which suggests at least one earlier year was higher. Without the full report we describe 2021 only as a spike.