




Healthcare organizations are buying analytics for a reason that is easy to state and hard to solve. There are not enough clinicians, there will be fewer, and the work has to be done anyway.
The World Health Organization’s September 2026 assessment projects a global shortfall of 11.1 million health workers by 2030, with 67 countries expected to lack the workforce to meet population health needs by then. Its sharper finding is demographic: across 122 countries, nearly one in four doctors is older than 55 and expected to retire within the decade: nearly one in three in high-income countries.
Healthcare business intelligence (dashboards, reporting and predictive models on clinical and operational data) cannot close that gap. It can show where scarce capacity goes and whether changes to the work are paying off, which makes it a reasonable response. The published evidence shows that it works inconsistently, and two factors come up again and again: the state of the data layer underneath, and whether the dashboard was designed into clinical work or delivered alongside it.
This guide is about those two things in hospitals and provider groups. Payer, pharmaceutical and public-health analytics raise different questions. The evidence comes from several health systems (German hospitals, EU-wide statistics and the United States), not from the Netherlands specifically, so a Dutch or other EU reader should treat it as indicative of the mechanism rather than as a local benchmark.
On this page
- What does the data layer actually look like?
- Why interoperable systems still do not interoperate
- Do clinical dashboards actually improve outcomes?
- Why do clinicians stop using them?
- What predictive models in hospitals look like in practice
- How to scope a healthcare analytics project
- Frequently asked questions
Key Takeaways
- A 2021 self-assessment covering 1,624 German hospitals, 91% of the total, scored information exchange at 25.1 out of 100, the third-lowest of seven dimensions.
- In a 2022 analysis of 2,897 Fast Healthcare Interoperability Resources (FHIR) profiles from 125 published implementation guides, about 35% of the elements marked as must-support were extensions or slices rather than native elements. That measures how much FHIR relies on local profiling, not how much data is lost in exchange.
- In 2025, 93–96% of US hospitals sent, received or found patient data electronically, but 79% integrated it into the record, and 40% still often sent care summaries by mail or fax.
- Across 70 studies of hospital dashboards, 15 of 20 mortality findings showed no significant change.
- A 2026 review of 22 systematic reviews on alert fatigue found only one that defined alert fatigue operationally.
- In a 2026 scoping review of 18 dashboard studies, half focused on evaluating the dashboard after it was built rather than on design principles during development.
- In 2024, 71% of US hospitals used predictive models integrated with the electronic record, for operational as well as clinical uses, against 59% of hospitals under 100 beds.
What does the data layer actually look like?
The broadest national picture of hospital data capability comes from Germany. The first DigitalRadar assessment, run in 2021, was a 234-item self-assessment completed by 1,624 hospitals, 91% of all German hospitals, because taking part was a condition of receiving money from the national Hospital Future Fund. It is self-reported, but close to a census rather than a sample, and it scored hospitals across seven dimensions out of 100.
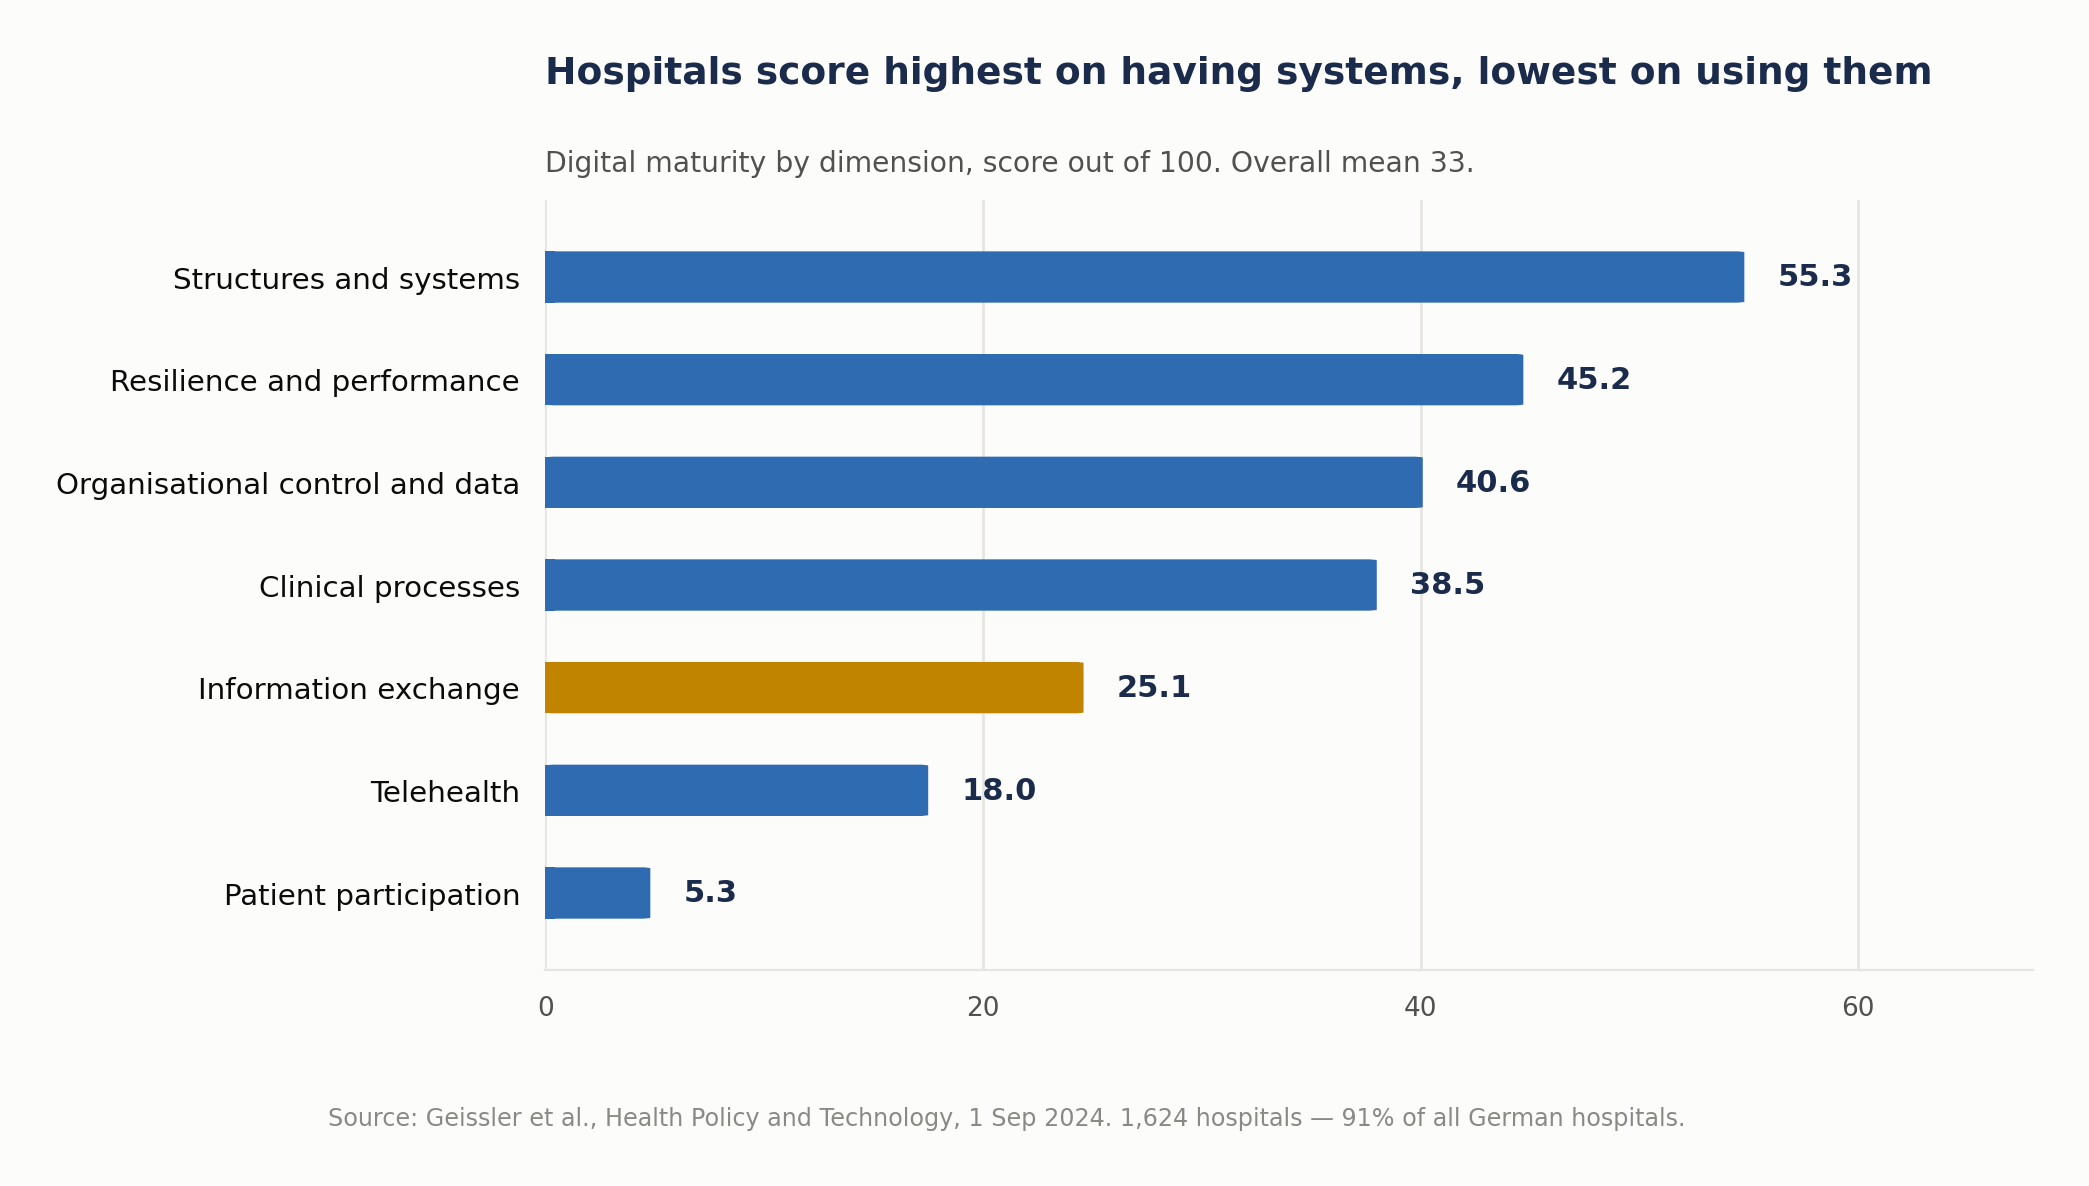
Source: Geissler et al., Health Policy and Technology, September 2024. A separate August 2026 analysis of the same 2021 survey (1,607 hospitals) reports a mean DigitalRadar score of 38.24 and does not explain the five-point gap with the figure above. Treat the overall score as approximate rather than as a benchmark; the dimension scores are more useful for comparing strengths and weaknesses.
The authors’ summary is blunt: maturity is “comparatively high in the structures and systems dimension, but low in the clinical processes, exchange of information, telemedicine and patient participation dimensions, suggesting that data exchange is hampered by a lack of interoperability.”
That gap (infrastructure present, exchange weak) is, in our view, the most important context for any healthcare analytics proposal.
A different European measure points the same way. The European Commission’s eHealth indicator study tracks how far citizens can access their own electronic health records. Its 2026 edition, measuring the position at 31 December 2025, put the EU-27 composite score at 87%, four points up on a year earlier, but medical images scored only 35% for availability, and private healthcare providers were connected to supply data at 66% against 85% for public providers. Identification and personal information score 98–100% and prescription data around 90%; images and data on medical devices and implants (59%) lag well behind.
Why interoperable systems still do not interoperate
This is where many healthcare analytics projects meet an unpleasant surprise, and one number helps explain it.
A 2022 analysis of 2,897 profiles in 125 published FHIR implementation guides found that about 35% of the elements those guides mark as must-support are extensions or slices rather than native FHIR elements: in the author’s words, “FHIR’s 80/20 rule is more like 65/35.” The OECD’s July 2026 interoperability working paper cites it as evidence that such elements “cannot be fully shared between different FHIR systems”.
The study counted how implementation guides are written. It did not test exchanges between hospitals, so it is not a measure of data lost in transit. Nor does must-support mean an element has to appear in every message: the base specification leaves each profile to define what “support” requires. What it does show is how much real-world FHIR depends on local profiling. Two systems can each be conformant and still handle the same information differently if they implement different guides, versions or code sets without an agreed mapping and a joint test.
US data shows a similar pattern. The federal health IT agency’s February 2026 data brief, covering 2,253 hospitals in the 2024 survey with a 51% response rate, found that when hospitals shared data between their electronic record and third-party technology, they “conducted this data sharing more often via proprietary APIs or non-API-based methods than standards-based APIs.” That counts which methods hospitals reported using, such as proprietary EHR APIs or HL7 interfaces, not how much data moved or how complete it was. Still, it suggests that standards-based APIs are not yet the default route for this kind of data sharing.
The four-domain picture from the 2025 survey of US hospitals shows the same shape:
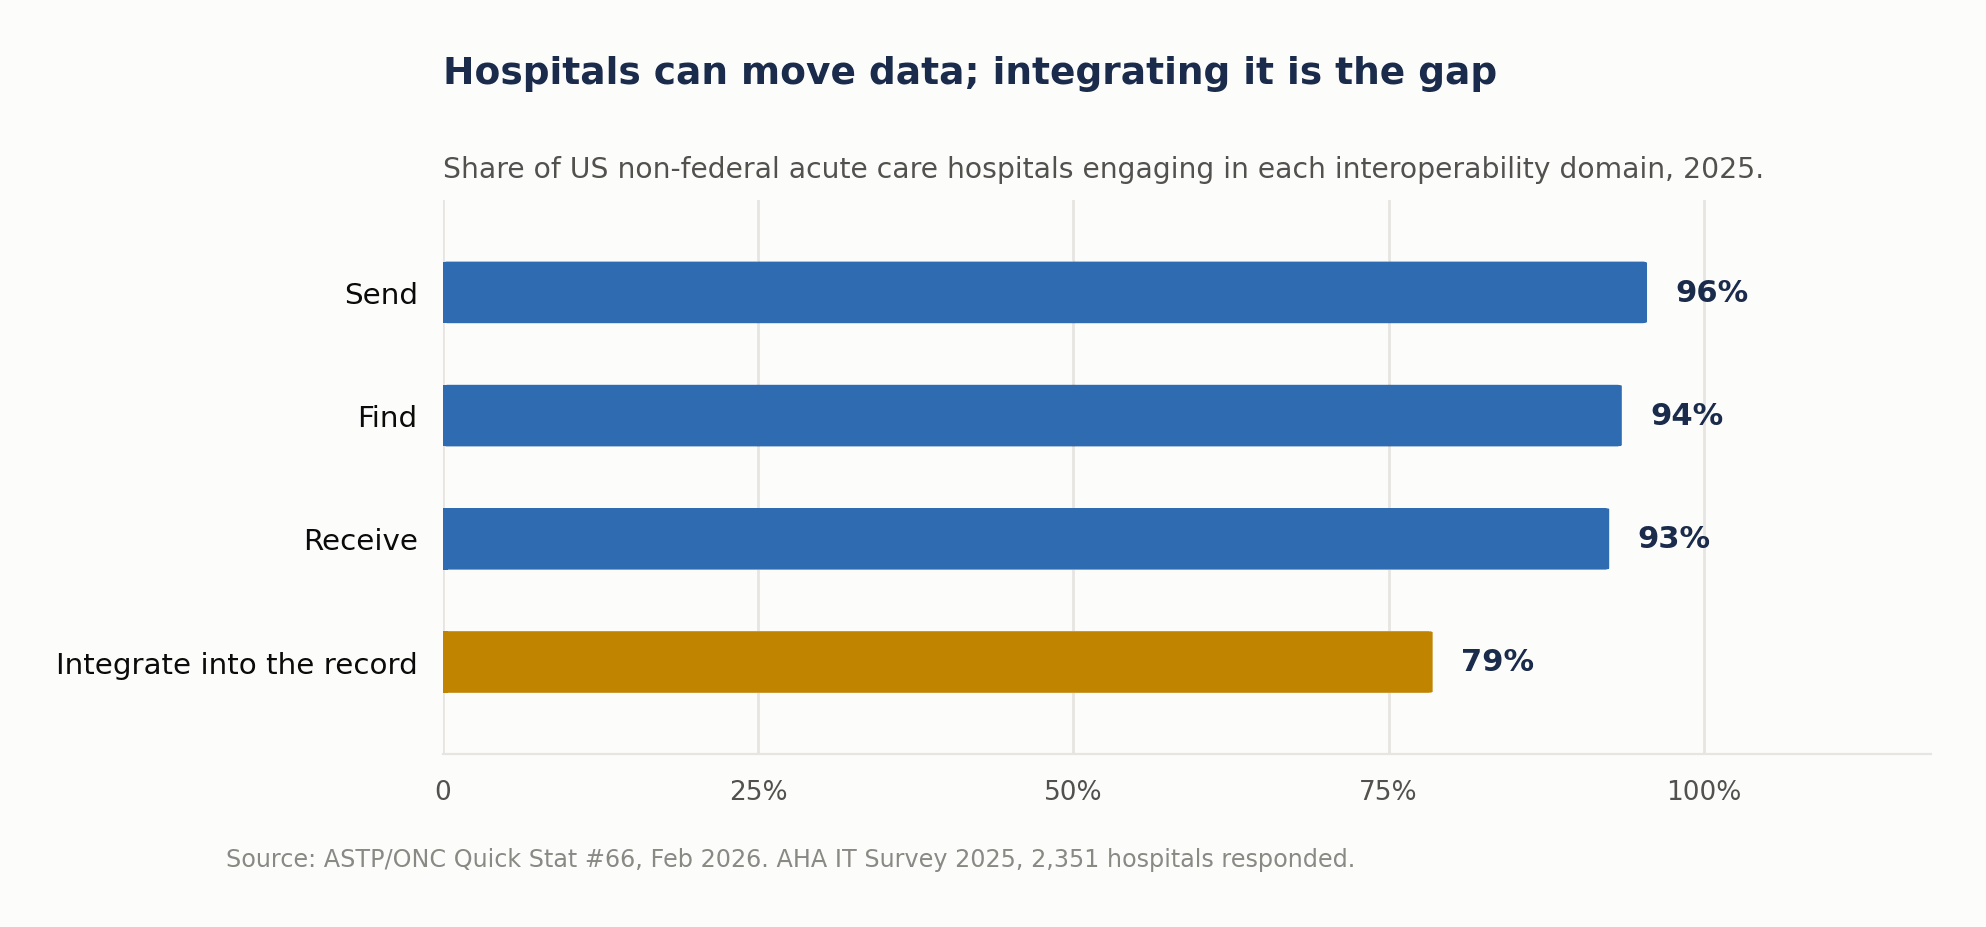
Integrating, making the received data usable inside the receiving system, is 14 to 17 points below the other three and, unlike them, did not rise significantly between 2023 and 2025. For analytics it is the domain that matters most.
Two further details are worth carrying into any scoping conversation. First, some of the friction is shrinking: between 2023 and 2025 the share of hospitals citing data formatting as a barrier fell from 41% to 25%, and patient matching from 31% to 19%, while “customized interfaces needed” barely moved, from 43% to 39%. Second, 40% of hospitals still often send summary-of-care records by mail or fax, up from 30% in 2023, and 35% often receive them that way.
| Measure, US hospitals | 2023 | 2025 |
|---|---|---|
| Data formatting cited as a barrier | 41% | 25% |
| Patient matching cited as a barrier | 31% | 19% |
| “Customized interfaces needed” cited as a barrier | 43% | 39% |
| Hospitals that still often send summary-of-care records by mail or fax | 30% | 40% |
If a proposal’s timeline assumes clean structured inbound data, that assumption is a major project risk and should be tested in the first two weeks.
What the standard actually is
Since this is where terminology gets used loosely: HL7’s FHIR specification describes itself as providing “Resources: a collection of information models that define the data elements, constraints and relationships for the ‘business objects’ most relevant to healthcare,” accessed through “a collection of well-defined interfaces,” with resources “optimized for stateless transactions with RESTful APIs.”
In other words: shared data models, rules for constraining them, terminology bindings and a set of interfaces, with RESTful APIs the main but not the only way resources are used. It is not a guarantee that two systems mean the same thing by the same field, which is the gap the 65/35 finding points to.
Do clinical dashboards actually improve outcomes?
One of the broadest syntheses available is a 2025 systematic review in JAMIA Open covering 70 studies drawn from 5,755 records, including 61 quasi-experimental (mostly before-and-after) studies and 6 randomized controlled trials, across the US, Taiwan, the UK, Australia, Canada and nine other countries.
Its results, outcome by outcome:
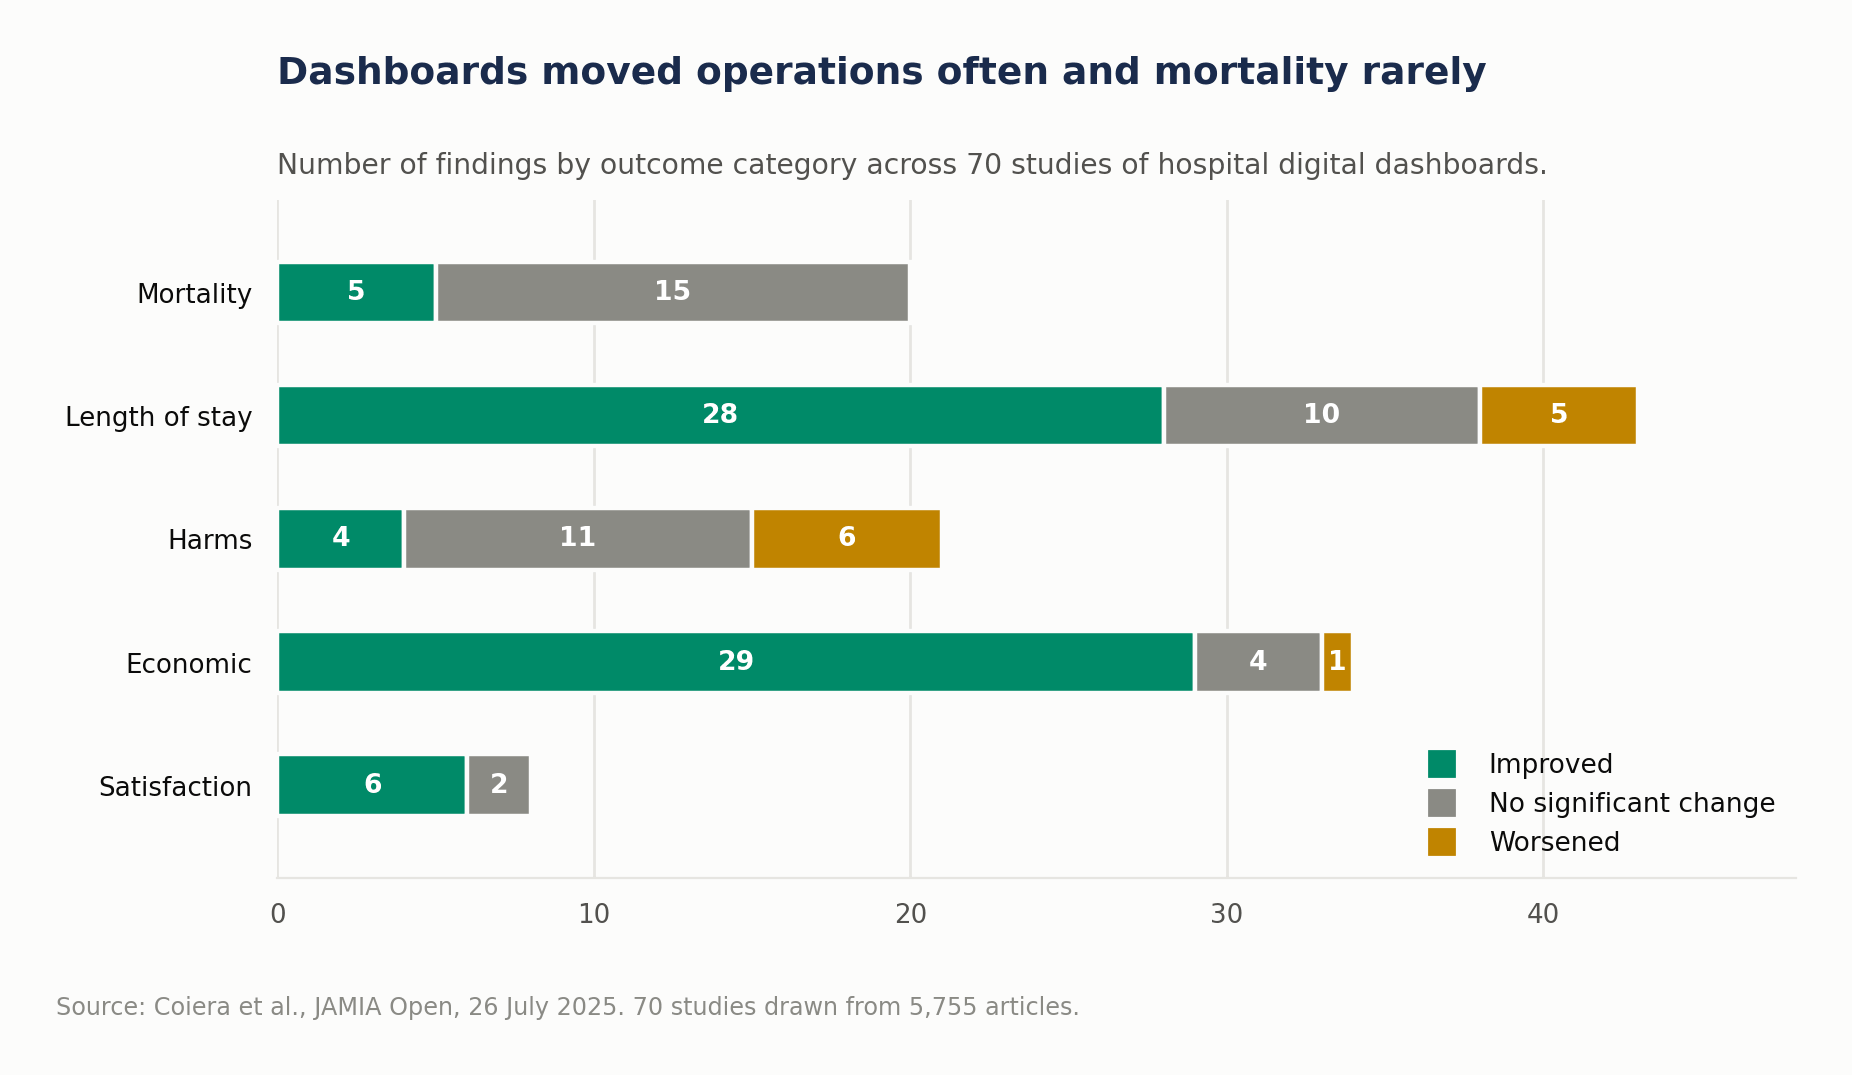
| Outcome | Findings | Result |
|---|---|---|
| Mortality | 20 findings across 16 studies | 5 showed a decrease; 15 showed no significant change |
| Length of stay | 43 findings across 31 studies | 28 reductions, 5 increases, 10 no change |
| Harms | 21 findings across 16 studies | 6 increases, 4 decreases, 11 no change: “equivocal” |
| Economic | 34 findings across 31 studies | 29 reduced costs, 1 increase, 4 no change |
| Satisfaction | 8 findings | 6 increases, 2 no change |
Where effects were found they were sometimes large: mortality reductions between 19.4% and 73% on different measures, length-of-stay reductions from 0.28 to 18.8 days, annual savings from US$160,000 to US$10.7 million, staff time savings from 132–198 hours to 11,200 hours a year. They come from single studies with different settings, measures and designs, too varied for the authors to pool, so they are possibilities, not planning benchmarks.
| Outcome | Range reported in single studies (not pooled) |
|---|---|
| Mortality reductions | 19.4% to 73%, on different measures |
| Length-of-stay reductions | 0.28 to 18.8 days |
| Annual savings | US$160,000 to US$10.7 million |
| Staff time savings | 132–198 hours to 11,200 hours a year |
But the review’s conclusion is the sentence to put in front of anyone approving a dashboard program: “actual impacts of hospital digital dashboard will likely be dependent on multiple local factors such as workflow integration.”
Two readings follow. The optimistic one: operational and economic outcomes improved in most published findings, which is a legitimate business case on its own. The realistic one: clinical outcomes mostly did not move, and harms are equivocal: six findings showed harms increasing, three of them statistically significant. A dashboard is an intervention in clinical work, not a neutral addition to it.
Why do clinicians stop using them?
Often because the design has not accounted for how little time a consultation leaves.
A 2025 qualitative systematic review of nine studies across the UK, Australia, Belgium, the Netherlands and Norway captured the mechanism in general practitioners’ own words: “so many things popping up, so many things prompting you”; one GP, having worked through “about three or four” prompts, described the next as “another 5 or 10 minutes of consultation (…) so you leave it.” Another avoided decision support during consultations “because of time problems, losing eye contact with patients.”
The field is not yet able to measure this properly. A May 2026 systematic review in JAMIA, covering 22 systematic reviews, found that only one reported an operational definition of alert fatigue. The most common metrics were quantity, override rate and acceptance rate: none of which, on its own, distinguishes a clinician who dismissed an alert correctly from one who stopped reading.
The design practice behind these tools is similarly immature. A February 2026 scoping review of 18 healthcare dashboard studies found 77.8% (14 of 18) were ad hoc rather than following a structured design approach, only a third emphasized integrating with workflows to avoid overburdening staff, and half focused on evaluating the dashboard after it was built rather than detailing design principles during development. One study in that review found that sustainable adoption “required embedding dashboards into governance routines and review meetings”; that is, the dashboard survived because it had a standing place in a meeting, not because it was well drawn.
The wider burden of record work is measurable, although this evidence concerns electronic records in general, not dashboards. A 2024 meta-analysis covering 66,556 healthcare professionals across 37 mostly cross-sectional studies found a pooled burnout prevalence of 40.4% in studies of electronic-record use, with those spending more time on record tasks outside work at higher odds of burnout (OR 2.43). That is an association, not proof of cause, but a reason not to add prompts lightly.
What predictive models in hospitals look like in practice
Adoption is already high and unevenly distributed. The US federal health IT agency’s 2025 data brief, based on the 2024 hospital IT survey (n=2,080, 51% response rate), reports that 71% of hospitals used predictive AI integrated with the electronic record, up from 66% the previous year. The definition is broad: predicting risks for inpatients was the most common use, but the fastest-growing ones were simplifying billing and facilitating scheduling.
Local validation practice is more encouraging than the debate usually suggests. Among hospitals using these models, 82% evaluated at least some of them for accuracy, 74% for bias, and 79% conducted post-implementation evaluation or monitoring; fewer did so for all or most models, and “don’t know” answers (15–21%) are excluded.
| Practice, among hospitals using predictive models | Share of hospitals (“don’t know” excluded) |
|---|---|
| Evaluated at least some models for accuracy | 82% |
| Evaluated at least some models for bias | 74% |
| Post-implementation evaluation or monitoring | 79% |
The gap follows hospital type:
| Hospital type | Predictive AI in the record |
|---|---|
| More than 400 beds | 96% |
| Fewer than 100 beds | 59% |
| System-affiliated | 86% |
| Independent | 37% |
| Urban | 81% |
| Rural | 56% |
The brief does not say why the gap exists; use also differs by record vendor (90% on the market-leading vendor against 50% on others). But the evaluation work above needs people who can do it.
How to scope a healthcare analytics project
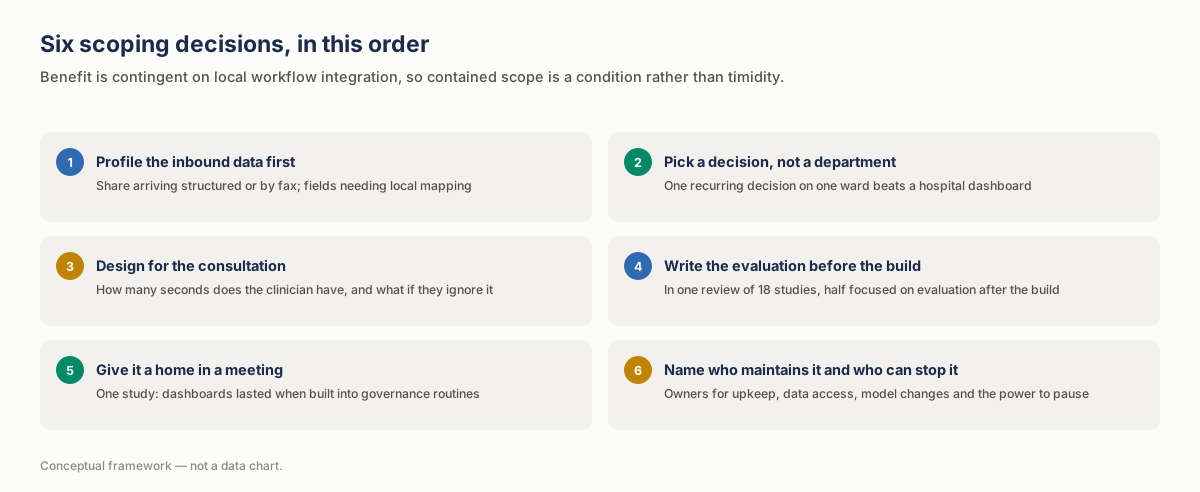
Six decisions, in this order:
| Step | Decision | What it means in practice | Done when |
|---|---|---|---|
| 1 | Profile the inbound data before quoting a timeline | Check what proportion arrives structured, what arrives on paper or by fax, and how many fields need local mapping. The 65/35 finding and the US fax figures are reasons not to assume it; your own mix will depend on country and partners. | Every input a KPI depends on has an owner, a refresh frequency, a completeness check and an agreed mapping |
| 2 | Pick a decision, not a department | “Reduce length of stay on this ward by identifying discharge blockers on the morning round” is scopeable. “A hospital dashboard” is not. | The project is stated as one decision, not as a department or a generic dashboard |
| 3 | Design for the consultation, not the screen | How many seconds does the clinician have? If the design adds another prompt, it needs a reason that outweighs the interruption. | There is a defined answer to what happens when the prompt is ignored |
| 4 | Write the evaluation before the build | In the scoping review above, half of the studies concentrated on evaluating after the build. The evaluation does not have to be sophisticated; it has to exist before anyone can be embarrassed by it. | The evaluation is written down before the build starts |
| 5 | Give it a home in a meeting | One of the clearer adoption findings in that review is that dashboards lasted when they were embedded in governance routines and review meetings. | A recurring meeting has the dashboard on its agenda |
| 6 | Name who maintains it and who can stop it | Smaller and independent hospitals lag on predictive AI, and upkeep has to sit somewhere, so make it an explicit line. The same list should say who can see which data, what is logged, how long data is kept, who approves a model change and who can pause or roll back the tool. | Each item is checked against the data-protection rules that apply where the tool will run |
Our healthcare and life sciences page covers how we approach the sector, and the general principles of dashboard design apply here with the workflow constraint made much tighter.
Frequently asked questions
Why do hospital dashboards show weaker clinical results than operational ones?
One plausible explanation: operational outcomes (length of stay, cost, staff time) sit in processes managers can redesign directly, while clinical outcomes depend on a clinician changing a decision mid-work, which requires the information to arrive at the right moment in a form that does not cost attention. The 70-study review shows the pattern, with economic outcomes improving in 29 of 34 findings while 15 of 20 mortality findings showed no significant change; it does not test the reason.
Our systems are all certified for the standard. Why is integration still hard?
Because conformance and compatibility are different things. In one analysis of 125 published FHIR implementation guides, about 35% of must-support elements were extensions or slices rather than base elements. Two conformant systems can still handle those elements differently unless they agree which guide, version and code sets to use, and test the exchange together. And in 2024, US hospitals sharing data between their electronic record and third-party technology still did so more often through proprietary APIs or non-API methods than standards-based ones.
Is predictive modeling premature for a smaller hospital?
Not premature, but it carries a staffing prerequisite. Among US hospitals running models, 82% reported evaluating them for accuracy, 74% for bias and 79% conducting post-implementation monitoring. If no named person can check performance and bias, watch for drift and incidents, and pause the model when it misbehaves, it is not ready for the live record.
How do we avoid adding to alert fatigue?
Start by accepting that you cannot currently measure it well: a 2026 review of 22 systematic reviews found only one that reported an operational definition. The same review recommends measuring it as a significant, sustained fall in appropriate alert responses from an established baseline, so set that baseline before go-live. Override rate alone is a weaker signal, because it cannot tell a correct dismissal from an unread one. Alongside that, review the highest-volume alerts with the clinicians who receive them.
What is the realistic first project?
One recurring decision, one ward or service line, one measurable before-and-after. The 70-study review concludes that benefit is likely to depend on local workflow integration, which means a contained scope is not timidity; it is the condition under which you can tell whether it worked.
Two consistent benefits, one contingent
The workforce pressure driving healthcare analytics is real, measured and getting worse. The response is reasonable. What the evidence adds is that the layer underneath is thinner than the certification statistics suggest, and that a dashboard is an intervention in clinical work rather than an addition to it.
The three findings worth carrying into any scoping conversation: information exchange scored 25.1 out of 100 in a near-census of German hospitals; about 35% of the must-support elements in published implementation guides are extensions or slices rather than native elements; and across 70 studies, most mortality findings showed no significant change while most operational and economic findings improved.
That last split is not a reason to avoid clinical analytics. It is a reason to be honest about which benefits have been consistent and to design the clinical ones around workflow from the first week rather than the last.
If your next analytics proposal assumes clean inbound data, test that assumption before the build is fixed. A current-state and gap assessment of your hospital data is part of our Discovery package, alongside quick-win recommendations and a roadmap with prioritized steps, typically over two to four weeks.
Related Articles
- BI by Sector: A Complete Guide for Dutch Mid-Market Companies — Business intelligence use cases by sector
- Enterprise Business Intelligence: What Breaks at Scale — How business intelligence works at enterprise scale
- Data Visualisation for BI: Encodings That Hold Up — Choosing the right visual for each question
Sources
Peer-reviewed
- Geissler et al., A nationwide digital maturity assessment of hospitals – Results from the German DigitalRadar, Health Policy and Technology 13(4), September 2024. 1,624 hospitals, 91% of all German hospitals, 2021 self-assessment (234 items).
- Backes et al., Does System Choice Matter? Influence of Hospital Information Systems on Digital Maturity, Journal of Medical Systems, 8 August 2026. 1,607 hospitals, 2021 DigitalRadar survey.
- Kramer, Reducing FHIR “Profiliferation”: A Data-Driven Approach, AMIA Annual Symposium Proceedings 2022 (published 2023). 2,897 profiles, 125 implementation guides (FHIR R4, registry accessed February 2022).
- Coiera et al., Clinical and economic impact of digital dashboards on hospital inpatient care: a systematic review, JAMIA Open, 26 July 2025. 70 studies from 5,755 records; narrative synthesis, as heterogeneity precluded meta-analysis.
- Ray et al., Alert fatigue measurement in clinical decision support: a systematic review, JAMIA, published online 18 May 2026 (August 2026 issue). 22 included systematic reviews.
- Gani et al., Understanding “Alert Fatigue” in Primary Care: Qualitative Systematic Review of General Practitioners Attitudes and Experiences of Clinical Alerts, Prompts, and Reminders, JMIR, 7 February 2025. 9 studies across 5 countries.
- Vornhagen et al., Design Practices for Data Dashboards in Health Care: Scoping Review, JMIR, 25 February 2026. 18 studies.
- Wu et al., Evaluating the Prevalence of Burnout Among Health Care Professionals Related to Electronic Health Record Use: Systematic Review and Meta-Analysis, JMIR Medical Informatics, 12 June 2024. 37 studies, 66,556 healthcare professionals.
Official statistics and government agencies
- World Health Organization, One in four doctors nearing retirement age as WHO warns of global health workforce gap, 18 September 2026, and National health workforce accounts: health workforce levels and trends 2026, 22 June 2026.
- OECD, Interoperability in healthcare: Towards an interconnected future, Health Working Paper No. 197, July 2026. 22 country survey responses, 41 interviews.
- ASTP/ONC, Quick Stat #66: Electronic Health Information Exchange by Hospitals, updated February 2026 (AHA IT Survey 2025, 54.5% response rate), Progress on Interoperability, 11 February 2026 (AHA IT Survey 2025), Data Brief 81, February 2026 (2024 survey, n=2,253, 51% response rate), Data Brief 80, September 2025 (n=2,080), and Quick Stat #70 on exchange methods, updated February 2026 (2,351 hospitals responded in 2025).
- European Commission, The 2026 Digital Decade eHealth Indicator Study, 17 June 2026, measuring the position as of 31 December 2025.
Standards body
- HL7 International, FHIR v5.0.0 architecture overview and FHIR R4 profiling: Must Support.